 |
by
Randi Burke
(with Dave Wilson)


Level: Beginner
Works with: Domino 5.0
Updated: 11/01/1999

Inside this article:
Server monitor views
Devising a monitoring plan
Setting up the monitor
Troubleshooting with the server monitor

Related links:
Domino 5 Administration Help
Extending the Domino Administrator (Part 1)
Domino R5 Technical Overview

Get the PDF:
 (347 KB) (347 KB)


|  |
Did you ever wonder if there was a way you could take all the servers in your network, list them all on one machine and have a tool keep an eye out for potential problems? Well, stop wondering, because there is a such a tool. Keeping your network trouble-free has never been easier when you use the Domino R5 server monitor. The Domino server monitor, included in the Domino Administrator, provides a graphical user interface (GUI) of all the servers on your network along with the tasks running on each server.
In earlier versions of Notes and Domino, you kept track of your network's status by using each server's server console. You typed a command and poof, information came streaming down the screen. Oh, and by the way, if you didn't catch it the first time, tough. Now there is no need to go to every server's server console to see what's happening on your network. Using the Domino server monitor, information for all servers is right there, right now, staring you in the face. Status icons let you know when things are good or when you better get moving and find the problem. This is real-time folks -- server status now!
When you finish this article, you will have an overall picture of the Domino server monitor, learn how to set it up, understand why it's important to your network strategy, and know how to use it as a troubleshooting tool. This article also includes information about Domino's statistics and events feature and the Domino Administrator itself. To get more information about Domino server monitor, Domino Administrator, and statistics and events, see Domino 5 Administration Help, particularly the following topics:
You choose the view
Accessing the Domino server monitor is a snap. In Domino Administrator, click the Server - Monitoring tab.

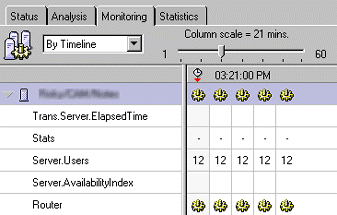
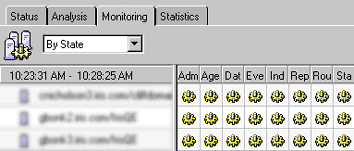
You can view the Domino server monitor in two ways: By Timeline view or By State view.
By Timeline view
Using the Column scale selector, you can monitor historical server status by sliding the pointer to adjust the time interval represented by each column.
By State view
The By State view shows you the current status of all the loaded server tasks and configured statistics on your machines.
Have a plan?
Hey, this GUI looks great, but where do I begin? The best place to start is with a network monitoring plan. For example, here are some questions you may ask yourself:
- Which servers do I want to monitor?
- How often do I need to poll my machines?
- Which tasks are vital to watch to ensure my network's integrity?
- Do I want to watch for specific system functions?
- What types of statistics do I need to watch?
You know your network and your organization's needs. While each network is unique, certain criteria is essential to make it all run smoothly. The Domino server monitor is preconfigured with a set of default tasks and statistics to get you on your way.
Preconfigured server tasks
The Domino server monitor comes preconfigured with these server tasks:
| Admin Process | Automates many routine administrative tasks, such as deleting users, creating replicas, and editing access control lists (ACLs) |
| Agent Manager | Runs agents on one or more databases |
| Database Server | Handles database activity |
| Event | Updates all changed views and/or full-text indexes for all databases |
| Replicator | Replicates databases with other servers and routes them to administrators |
| Router | Routes mail to other servers |
| Stats | Mails statistic collection documents |
Preconfigured statistics package
The Domino server monitor comes preconfigured with these statistics:
| Server.Users | Number of user transactions on the server |
| MAIL.Dead | Number of undeliverable messages in MAIL.BOX |
| MAIL.Hold | Mail that is not deliverable at this time but may be later |
| MAIL.Waiting | Number of out going mail messages waiting to be either delivered locally or transferred in MAIL.BOX |
| Server.AvailablityIndex | Server load computation based on Domino load and HTTP load |
Trans.Server.
ElapsedTime | Elapsed time since the server was started |
How do I set up the Domino server monitor?
Glad you asked. Setting up the Domino server monitor is easy, so easy in fact, no setup is required. All you have to do is go to the Server - Monitoring tab and click the "Start" button. Now all the servers that have Server documents in the Domino Directory of your home server begin to be monitored. If the default behavior is not appropriate, configuration is a snap with easy-to-use configuration wizards and user friendly dialog boxes.
Now that you planned your network monitoring strategy, let's begin!
Task 1 -- Configure the server monitor's Administration Preferences
Administration Preferences! Quick, get me the Admin guide. Don't panic -- this is just a fancy name for describing how the Domino server monitor functions on your system. Hey administrators -- they developed this feature with you in mind, you can sit back and keep the defaults or customize the settings to your particular needs.
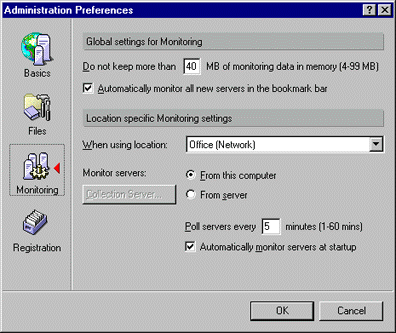
For more information on Administration Preferences, see Domino 5 Administration Help.
Task 2 -- Choose the servers you want to monitor
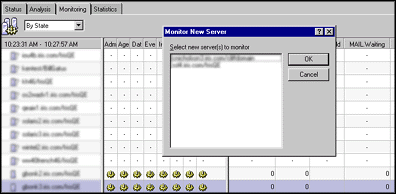
By moving the cursor on the server panel and performing a quick right-click of the mouse, you can choose a server to monitor from a list of servers for the domains configured for Domino Administrator.
Task 3 -- Determine which task you want to monitor
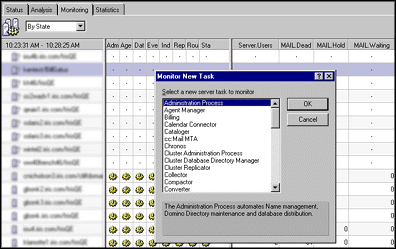
Again, by moving the cursor to the task pane and right clicking the mouse, you can choose the task you want to monitor.
Okay, let's think about this -- here's a list of server tasks, which tasks do I really need to monitor and what do all these tasks do any way? As mentioned earlier in this article, the Domino server monitor is preconfigured with a set of default tasks; however, you may want to add additional tasks to the pre-existing tasks listed on the tasks panel. The bottom line of the of server monitoring is to monitor the tasks that are important to your particular environment.
The Monitor New task dialog box provides a short definition of all tasks listed, but if you want more information about a specific task, check out Domino 5 Administration Help.
Task 4 -- Choose the statistics you want to monitor
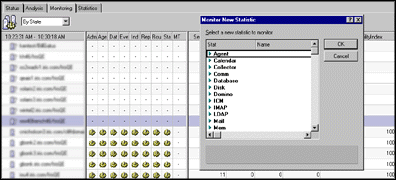
In other words, what kind of information do I need to watch for when I'm running a particular service? Statistics are key in warning you when something really bad is about to happen. By monitoring statistics, you have the ability to stop a problem before it happens.
Troubleshooting? No problem!
Okay, now you have the Domino server monitor set up and running, and you see that most of the server names appear with different symbols next to them. What does all this mean? Here's a quick look at the status indicators:
| Icon | Indicates | Meaning |
| Running | Task is running without a problem |
| Warning | Task is running, but warning errors are being generated |
| Not responding | Task is running slowly |
| Failure | Task is running, but failure errors are being generated |
| Not running | Task has not been running since the server monitor started |
| Fatal | Task is running, but fatal errors are being generated |
Troubleshoot by what's most interesting
Basically, the server monitor divides the servers it is monitoring into four groups, sorted from most interesting to least interesting.
That is, the group at the top of the display are the servers that the Domino server monitor saw running at some time in the past but are now no longer responding to its probing. To see the error being returned by the probe, move the mouse over the server name.
The second group of servers are those which have a configured task that is either reporting an error or is no longer running. The Event task on R5 servers keeps track of the number of errors reported by each server task and each task is enhanced to maintain a "heartbeat." If the error count for a server task has changed incremently or its heartbeat has not changed, the server will be listed in this second group.
The third group of servers are those configured for monitoring but the Domino server monitor has not been able to contact since it was started.
The final group are the running servers whose configured tasks are all running without any errors.
So the first group of servers is the most interesting (nobody likes a down server) and the second group is the next most interesting (I'd like to nip some small errors in the bud before they become big errors), but how do I work with the second group? I have other things to do than just watching the monitor, waiting for some new server to show up in group two so I can fix an error that may or may not happen. Answer: start in the By Timeline view.
The By Timeline view of the Domino server monitor shows the history of activities that occurred on the servers. Adjusting the slider allows you to configure the length of the timeslice represented by each column. So let's take a look.
In this example. we adjusted the column scale so each column represents 10 minutes. We scroll down to the area where the currently "okay" servers are and see that the server Montana has reported some warning errors at some time in the past. We can expand Montana in this view to see which task reported the errors and get the approximate time.
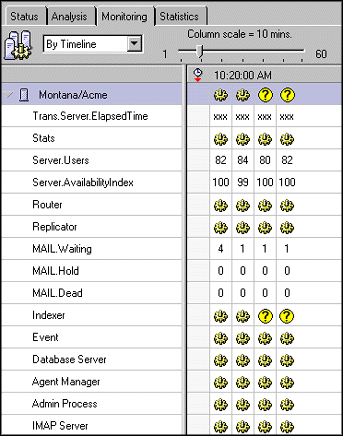
We can then switch to the By State view to get an exact time that the monitor detected the error. By clicking on the twistie (that appears when errors occur) we can see that the monitor detected the server's Indexer had incremented its error count at 9:18, 9:20, 9:22, 10:16, and 10:18 -- there are some real problems going on here.
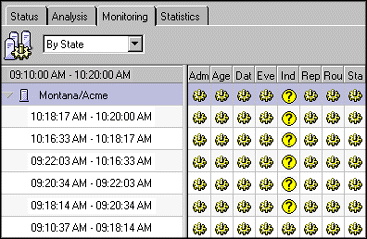
To determine the exact error that occurred (we'll find the one detected at 9:18), we select Montana/Acme from the Domino Administrator bookmarks, click the Analysis Tab, and go to the Miscellaneous Events view of the log (because the error was in the Indexer -- if the error was with the Router or Replicator, we would go to their specific views).
We open the log document that has the events logged at 9:18 and start looking backwards for the entry for the exact error (remember, 9:18 is the time the monitor detected that the error count had incremented, the actual error occurred either at 9:18 or some time in the past). Here's what we found:
08/24/99 09:18:13 AM Error full text indexing document NT002CF0CE in database e:\notefile\Support\tracking.ft: Field is too large (32K) or View's column & selection formulas are too large
08/24/99 09:18:13 AM Error full text indexing Support\tracking.nsf: Bad document ID/key
We lucked out because the error occurred close to the time the monitored detected it -- sometimes the error will have occurred a few minutes before it is detected and you'll have to work back through the log.
With that all said...
The Domino server monitor is a great diagnostic tool that ensures you that your network is running trouble-free. You no longer need to go to each server to find out what's happening on machine. So go to the Domino Administrator and give the Domino server monitor a spin!
ABOUT RANDI
Randi worked as a Technical Writer for 16 years in Network and Communications. She worked for Lotus for three years and has moved to the Iris Networking QE team, testing the X.PC protocol. At the end of the day, Randi enjoys playing with her three girls, weight lifting, and reading.
ABOUT DAVE
Dave Wilson holds a Bachelor of Arts Degree (English) and a Bachelor of Science Degree (Mathematics) from the University of Massachusetts at Lowell. He has worked as a software engineer for 14 years -- five at Iris Associates working on User and Server Administration and the Administration Process. His current hobby is trying to remember what his hobbies were before he began developing code for R5. |