|
|


 | [back to "Optimizing server performance: Domino clusters (Part 1)"]
Concurrence in updating replicas results (sidebar)
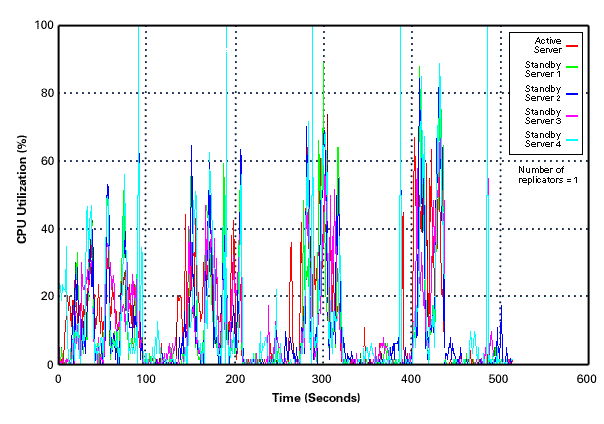
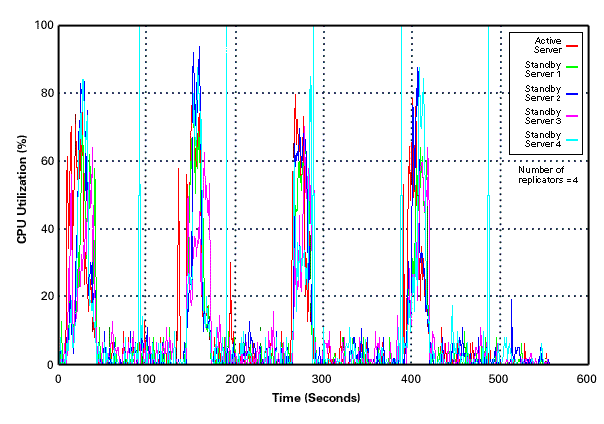
The following two charts show the CPU utilization when varying the Cluster Replicator tasks from one to four. The CPU utilization indicates the level of activity in a server. Therefore, it shows the timings of when the updates to the mail databases in the active server are propagated to the replicas on the four standby servers. (Note: These results show the timings, while Scenario 2 only showed overall CPU utilization.)
This chart shows the results with one Cluster Replicator on the active server.

This next chart shows the results with four Cluster Replicators on the active server. Notice that in this chart, the bands are narrower than in the previous one, indicating that the replication occurred faster.

 |
 |  |
|