|
|

 [back to "Optimizing server performance: HTTP Threads settings"] [back to "Optimizing server performance: HTTP Threads settings"]
HTTP Threads Settings Test Results (sidebar)
These are the results we found when testing how the HTTP threads setting affects server response time and resource utilization. We measured the impact of changing the HTTP threads setting by monitoring Domino transactions (NotesMarks), response time, CPU utilization, memory utilization, and disk response time.
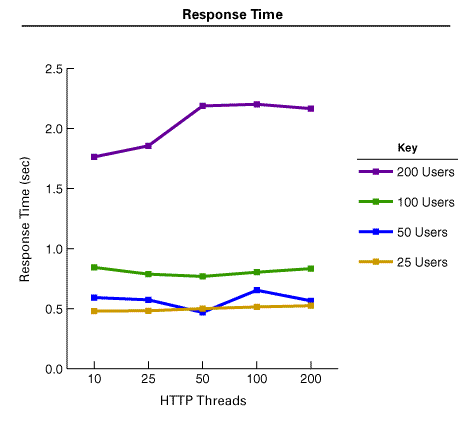
WebMail user response time (seconds)
This chart displays the average WebMail user response time that results when we vary the number of WebMail users as well as when we vary the number of HTTP threads. We can view the effect of increased user load for a given HTTP thread setting by reading the appropriate column. Similarly, we can view the effect of increased HTTP thread settings for a given user load by reading the appropriate row.
As expected, for a given number of HTTP threads, if we increase the user load, response time will increase (that is, worsen). For example, if you read the first column (10 HTTP Threads), the response time steadily increases from 0.481 to 1.764 seconds as we increase the user load from 25 to 200 users.
However, for a given WebMail user load (read across a row), the response time is not improved, and in some cases, worsens, if you increase the number of HTTP threads. For example, consider the last row of the chart (200 WebMail users). As you read across the row, the response time worsens, from 1.764 seconds at 10 HTTP threads to 2.166 seconds at 200 HTTP threads. |
WebMail Users | 10 HTTP
Threads | 25 HTTP
Threads | 50 HTTP
Threads | 100 HTTP Threads | 200 HTTP Threads |
25 | 0.481 | 0.483 | 0.501 | 0.515 | 0.525 |
50 | 0.593 | 0.574 | 0.469 | 0.654 | 0.566 |
100 | 0.844 | 0.788 | 0.769 | 0.804 | 0.834 |
200 | 1.764 | 1.856 | 2.188 | 2.202 | 2.166 |

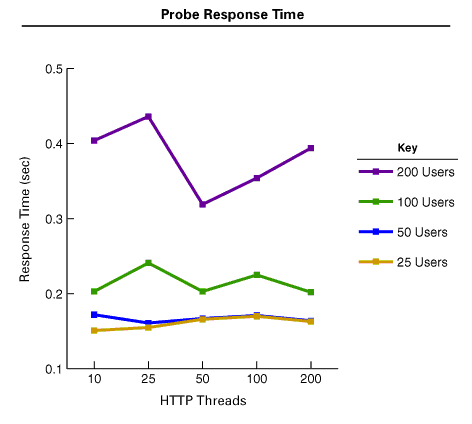
NotesBench probe response time (seconds)
This chart displays the average NotesBench probe (operations over the HTTP protocol) response time that results when we vary the number of WebMail users as well as when we vary the number of HTTP threads. The probe response time differs from the user response time in that it represents the average response time for a specific request, in this case, opening the Inbox. The user response time is the average time for all the requests that comprise the WebMail workload (opening the Inbox, sending mail, and deleting mail).
Again, as expected for a given number of HTTP threads, if we increase the user load, response time will increase (that is, worsen). Also, like the WebMail user response time behavior, the probe response time is not improved when you increase the number of HTTP threads. |
WebMail Users | 10 HTTP Threads | 25 HTTP Threads | 50 HTTP Threads | 100 HTTP Threads | 200 HTTP Threads |
25 | 0.151 | 0.155 | 0.166 | 0.170 | 0.163 |
50 | 0.172 | 0.161 | 0.167 | 0.171 | 0.164 |
100 | 0.203 | 0.241 | 0.203 | 0.225 | 0.202 |
200 | 0.404 | 0.436 | 0.319 | 0.354 | 0.394 |

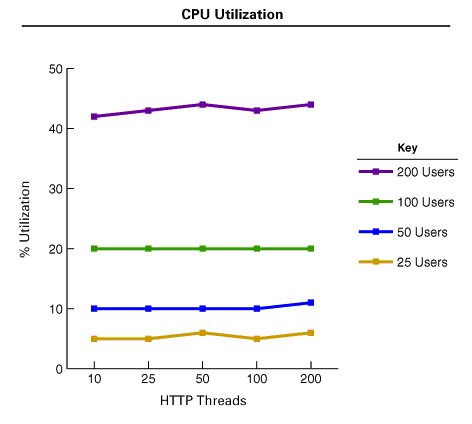
Server CPU utilization
This chart displays the CPU utilization on the server when we vary the user load as well as when we vary the number of HTTP threads. As you can see, for a given user load, the CPU utilization is not affected by an increase in HTTP threads. |
WebMail Users | 10 HTTP Threads | 25 HTTP Threads | 50 HTTP Threads | 100 HTTP Threads | 200 HTTP Threads |
25 | 5 | 5 | 6 | 5 | 6 |
50 | 10 | 10 | 10 | 10 | 11 |
100 | 20 | 20 | 20 | 20 | 20 |
200 | 42 | 43 | 44 | 43 | 44 |

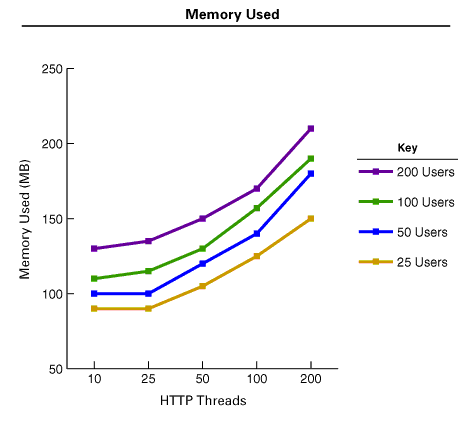
Memory used (committed bytes in MB)
This chart displays the memory used on the server when we vary the user load as well as when we vary the number of HTTP threads. As you can see, for a given user load, the memory used increases when the HTTP threads setting is increased. Since we obtain no performance improvements with the increased HTTP threads, this additional memory utilization is essentially "wasted." |
WebMail Users | 10 HTTP Threads | 25 HTTP Threads | 50 HTTP Threads | 100 HTTP Threads | 200 HTTP Threads |
25 | 90 | 90 | 105 | 125 | 150 |
50 | 100 | 100 | 120 | 140 | 180 |
100 | 110 | 115 | 130 | 157 | 190 |
200 | 130 | 135 | 150 | 170 | 210 |

Logical average disk queue length
This chart displays the average disk queue length of the server volume containing the \data directory when we vary the user load as well as when we vary the number of HTTP threads. Disk queue length is the number of both read and write requests that were queued. The larger the value, the more I/O-bound the server is. In this case, we see that increasing the HTTP threads results in an increase in the average disk queue length and therefore, increased I/O overhead. |
WebMail Users | 10 HTTP Threads | 25 HTTP Threads | 50 HTTP Threads | 100 HTTP Threads | 200 HTTP Threads |
25 | 0.04 | 0.05 | 0.05 | 0.06 | 0.07 |
50 | 0.10 | 0.09 | 0.08 | 0.08 | 0.10 |
100 | 0.20 | 0.18 | 0.14 | 0.16 | 0.16 |
200 | 0.40 | 0.35 | 0.40 | 0.44 | 0.62 |

|