|
|

| [back to "Optimizing server performance: Domino clusters (Part 1)"]
Cluster replication test results (sidebar)
The following sections first show our test results for the CPU utilization for 100 users. Then, you can see the results for our light, medium, and heavy user workload tests with varying numbers of users.
CPU utilization for 100 users
The following table shows the percentage of CPU utilization for 100 users in the different clustered/non-clustered configurations. In general, the results show that cluster replication causes the CPU utilization to increase significantly on the active server.
Notice that for Config 4, the results are approximately equal to the sum of the results for Config 2 and 3 -- that is, it's the result of the base workload in Config 2, plus the initiating and receiving replication results in Config 3. The heavy workload is an exception. The disk I/O became a bottleneck for that workload, so the CPU usage was restricted. (The columns don't add exactly since they are derived from separate tests.)
 | Config 1 | Config 2 | Config 3 | Config 4 |
Mail User Type | Single server, no mail transfers (Total CPU %) | Two servers, mail transfers to "standby" server (Total CPU % on active server) | Clustered "active" server (CPU % due to initiating replication only) | Clustered "standby" server (CPU % due to receiving replication only) | Clustered "active" server, initiates & receives replication (Total CPU %) |
| Light | 5.7 | 6.5 | 5.3 | 4.4 | 16.6 |
| Medium | 7.0 | 9.3 | 7.7 | 6.1 | 23.2 |
| Heavy | 16.0 | 20.0 | 18.0 | 17.0 | 35.2 |
Light user workload for varying numbers of users (using Config 4)
Next, we ran the light user workload for 100, 200, 300, and 400 users. This time, we used the Config 4 clustered configuration -- two clustered, "active" servers with mail transfers and replication.
In our configuration, each server has mail transfers (like in Config 2), and both servers initiate and receive replication (like the clustered servers in Config 3). As shown in the table below, the disk write rate for 100 light users is 201Kbytes/s. This value is a result of receiving mail from the clients and from replication of mail from the other cluster member.
The following table shows the complete results for the light user workload:
# of users | CPU utilization (%) | Disk writes (Kbytes/s) | Disk utilization (%) | Client response time (ms) | Probe response time (ms) |
100 | 16.6 | 201 | 82.0 | 49.4 | 65.3 |
200 | 34.6 | 295 | 98.5 | 69.9 | 106.0 |
300 | 34.9 | 342 | 99.9 | 148.5 | 152.0 |
400 | 34.2 | 346 | 100.0 | 246.2 | 227.0 |
Note: The client response time is from a NotesBench measurement, and the probe response time is from a Server.Planner measurement. For more information on NotesBench and Server.Planner, see the NotesBench Web site.
Medium user workload for varying numbers of users (using Config 4)
Next, we ran the medium user workload for 100 and 200 users. Again, we used the Config 4 clustered configuration -- two clustered, "active" servers with mail transfers and replication.
The following table shows the complete results for the medium user workload:
# of users | CPU utilization (%) | Disk writes (Kbytes/s) | Disk utilization (%) | Client response time (ms) | Probe response time (ms) |
100 | 23.2 | 245 | 85.6 | 82.0 | 85.0 |
200 | 40.5 | 384 | 99.0 | 161.0 | 147.0 |
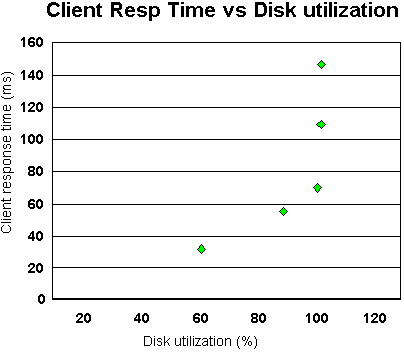
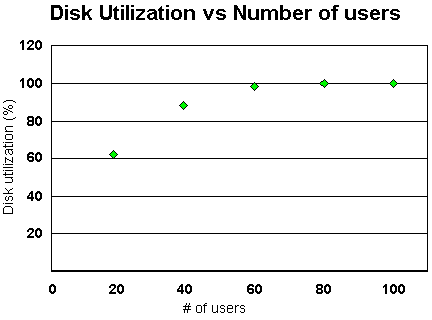
Heavy user workload for varying numbers of users (using Config 4)
Next, we ran the heavy user workload for 20, 40, 60, 80, and 100 users. Again, we used the Config 4 clustered configuration -- two clustered, "active" servers with mail transfers and replication.
By this time, you can notice that the client and probe response times increase rather steadily with additional users. The response time is probably the most important performance metric because it measures how responsive the server appears to users. If users often experience response times of more than one second, the server is generally considered to be too busy.
The following table shows the complete results for the heavy user workload:
# of users | CPU utilization (%) | Disk writes (Kbytes/s) | Disk utilization (%) | Client response time (ms) | Probe response time (ms) |
20 | 14.6 | 164 | 61.2 | 30.3 | 50.3 |
40 | 25.4 | 312 | 89.2 | 55.4 | 65.4 |
60 | 33.5 | 417 | 99.3 | 70.0 | 82.5 |
80 | 34.0 | 503 | 99.9 | 109.6 | 85.8 |
100 | 35.2 | 529 | 100.0 | 146.6 | 109.2 |
Note that at 60 users, the disk subsystem was saturated and was a bottleneck. This is the reason that the CPU usage did not increase for the 80-user and 100-user tests.
The following graph shows further how the disk saturation affected the client response time.
This next graph shows the disk utilization as related to the number of users.
|
| |
|