 |
by
Brian Arffa
and Barbara Burch


Level: Beginner
Works with: Domino 4.6
Updated: 11/03/1997

Inside this article:
The tools for monitoring statistics & events
Tips for using the monitoring tools

Related links:
Measuring your Domino server's reliability
Domino Administration Help
Domino Performance Zone

Get the PDF:
 (228 KB) (228 KB)


|  |
In many ways, a Domino administrator is like an orchestra conductor -- keeping the servers in an organization running like a well-oiled machine, while staying in the background. One way to do this is by continuously monitoring the health of your servers. By using Domino's statistics and events, you can keep track of the conditions that occur on your servers, and you can have the servers notify you about these conditions. For example, you can be automatically notified whenever a server is running low on disk space, whenever mail is backing up on a server, whenever a database has failed to replicate, whenever someone has changed the ACL of a database, or whenever any important message has been logged to the server console. So, you'll be one step ahead of potential problems.
This article will first introduce you to the tools for monitoring Domino's statistics and events. You'll then learn some tips for using these monitoring tools, including the reasons for creating different event monitors and statistics monitors. For more information on statistics and events, such as the specific steps for setting up the monitoring tools, see the Domino Administration Help.
The tools for monitoring statistics & events
We'll discuss Domino's monitoring tools in terms of the following three key server tasks:
- The Event task (EVENT.EXE)
- The Reporter task (REPORT.EXE)
- The Collector task (COLLECT.EXE)
The Event task
You use the Event task to monitor events, which are signals from one server add-in program to another, usually indicating that something of interest has occurred. You can monitor database-specific events, such as whether the ACL of an important database changes, or you can monitor general events, such as whether a certain mail or security type of event occurred.
To use the Event task, you simply specify "If an event of this type and severity occurs, do this..." To do this, you create monitor documents in the Statistics & Events database (events4.nsf). You can create ACL monitors, replication monitors, or general event monitors. You then select the severity level you're interested in, and how the task should notify you when the event occurs. The task can send e-mail, log the event to a database (usually the Statistics database, statrep.nsf), relay the notification to another server (via a network session), an SNMP trap report (for an SNMP-enabled application such as NotesView), or log to the Windows NT Event Viewer. You can also select for event notifications to go to a custom application.
In Release 4.6, the following monitor documents are created by default when you set up a new server:
- An ACL Monitor to generate a Security event of Warning (High) severity if the ACL for NAMES.NSF changes. In addition, notify the server administrator by mail.
- A Replication Monitor to generate a Replication event of Warning (High) severity if NAMES.NSF, on the server has not replicated in 24 hours with ANY server. In addition, notify the server administrator by mail.
- Event Monitors for each event type stating "If an x event of Failure severity occurs, log notification to statrep.nsf."
The Reporter task
You can use the Reporter task to collect various server statistics and to generate alarms when a statistic reaches a certain threshold. To use the Reporter task, you simply specify how often you want to collect statistics, how often you want them analyzed, and where to report them. To do this, you create Server to Monitor documents in the Statistics & Events database (events4.nsf). The task can either log the statistics to a database (usually the Statistics database, statrep.nsf) or mail them to a database.
The Reporter task also generates Analysis Report and File Statistics documents, which appear in corresponding views in the Statistics database. The Analysis Report document provides the average, lows and highs of reported statistics for a specified interval. This document is good for looking at information over a period of time (day, week, or month) so you can spot any trends. For example, if you see the available memory lapse into the "painful" state during a certain time every day, you may need to add more memory to your server. The File Statistics document provides the replica ID, size, amount of unused space in KB, percent of used space, and user activity for each database and template on the server.
You can also use the Reporter task to generate alarms for when a statistic reaches a certain threshold. To do this, you create Statistic Monitor documents in the Statistics & Events database. You then specify a threshold value at which you want the alarm to trigger, and a corresponding Event severity level. When the statistic exceeds your threshold, the task sends an alarm to the Statistics database (statrep.nsf).
As shown below, you must run the Reporter task on each server for which you want to collect statistics. Then, the Reporter task on each server, by default, reports statistics into its own Statistics database (statrep.nsf).
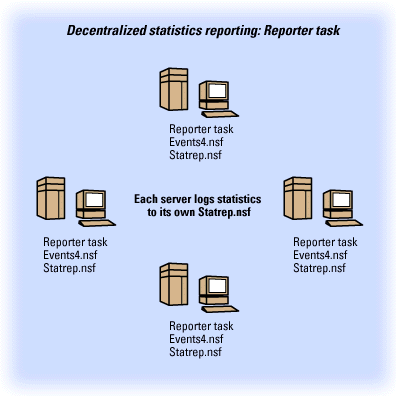
Another way to set up the Reporter task is to report the statistics into one Hub server's Statistics database. For this to work, the spoke server and the Hub server need to share a common network protocol.
In Release 4.6, the following monitor documents are created by default when you set up a new server:
- A Server to Monitor document to gather statistics every 60 minutes, analyze them daily, and log the statistic report directly to the local statrep.nsf.
- A Statistic Monitor stating that if less than 10% of disk C: is free, generate a Warning (high) statistic event.
- Statistic Monitors stating that if less than 10MB of the server's swap file is free (or on NetWare, the SYS volume), generate a Fatal statistic event.
- Statistic Monitors stating that if more than 5 mail messages are dead or pending, generate a Failure statistic event.
- A Statistic Monitor stating that if less than 5MB of the server's memory is free, generate a Fatal statistic event.
The Collector task
The other way to collect statistics is by using the Collector task. You can use the Collector task to gather statistics from multiple servers. While the Reporter task must run on each server from which you want to collect statistics, the Collector task needs to run on only one, collecting server. However, the Collector task doesn't generate statistical analysis reports or file statistic reports.
Similar to using the Reporter task, you use the Collector task by specifying how often you want to collect statistics, how often you want them analyzed, and where to report them. This time, you create Server to Monitor documents in the Collector Config database (collect4.nsf). The task can either log the statistics to a database (usually the Statistics database, statrep.nsf) or mail them to a database.
Also, like with the Reporter task, you can generate alarms for when a statistic reaches a certain threshold. To do this, you create Statistic Monitor documents in the Collector Config database. You then specify a threshold value at which you want the alarm to trigger, and a corresponding Event severity level. When the statistic occurs, the task sends an alarm to the Statistics database (statrep.nsf).
As shown below, the Collector task only needs to run on one Hub server. All statistics will then appear in the Hub's Statistics database (statrep.nsf).
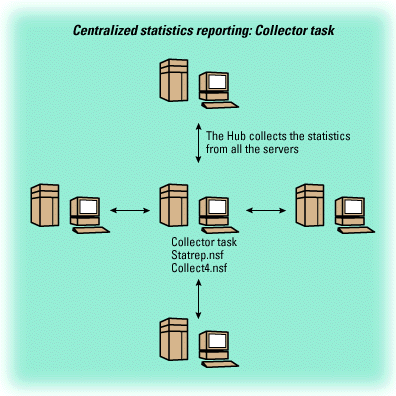
When the Collector task is first started, it creates some default thresholds for you (for example, for disk space, mail, and memory).
Tips for using the monitoring tools
Now that you understand the different monitoring tools, let's discuss some ways that you can use them.
ACL Monitors
ACL monitors, which require the Event task, are a great tool to keep you posted on changes made to any database ACLs. Let's say you are in the process of bringing centralized Notes administration to your organization. One of the tasks of a Notes administrator is to ensure that databases are replicated properly to all their destinations. Since a change in database access can affect replication (what you can't read, you can't replicate), you can create ACL Monitor documents to keep tabs on access levels of key databases.
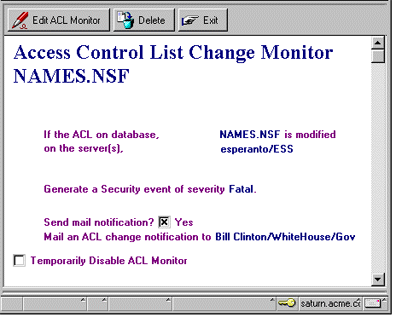
The following screen shows a sample ACL Monitor document for monitoring changes to the ACL of the Public Address Book (NAMES.NSF). Notice that this document specifies to only monitor the database on the server esperanto/ESS. Since this database is the most important one in a domain, we've selected the highest severity level, Fatal, to ensure that no changes occur to the ACL without our knowledge.
And, here's what the mail notification looks like when someone modifies the ACL.

Replication Monitors
Replication monitors, which also require the Event task, are another great way to have information come your way, as opposed to having to go out and look for it. You can use Replication monitors to keep track of important databases to ensure they're replicating. You have flexibility with which servers you'll want to be tracking, a time period of when you're tracking the database(s), which databases you'll want to keep track of, who gets notified, and if an event gets created as a result of a replication failure. These documents are great for when you're rolling out an application. Once you set them up, you won't have to comb through log files to make sure the data from the application is making it along each hop of the replication cycle.
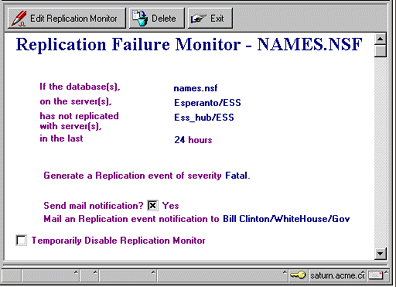
The following screen shows a sample Replication Monitor document for monitoring replication of the Public Address Book (NAMES.NSF). Because we want to make sure the server Esperanto/ESS replicates the address book with the Hub daily, we set the interval for this monitor to be every 24 hours. Again, since this database is so important, we've selected the highest severity level, Fatal.
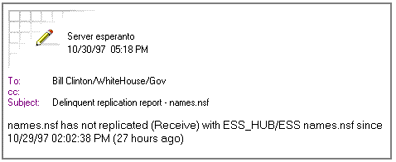
And, here's what the mail notification looks like when the Public Address Book hasn't replicated.
Event Monitors
Think of event monitors as the firepower in your arsenal. Event monitors, which also require the Event task, can help you in the following situations:
- Let's say you're having a problem with SPX binding to the network card on your server. The problem might manifest itself by having the server drop out of the bindery. You can create an event monitor to track the message, "can't read Notes network address from the bindery," which maps to the Comm/Net event type (because it's network-related). The Event Monitor document would look like the following screen.

- Let's say there are network problems happening in your environment that cause the DNS to periodically become unavailable. You could create an event monitor to track the message, "The Notes server is not a known tcp/ip host," which again maps to the Comm/Net event type (because it's network-related). You can create this monitor document exactly like the one shown previously.
In the same idea, for any other network-related problems (or if the server has been taken down all together), create an event monitor to track the message, "remote system no longer responding" so you can keep abreast of your servers' availability. If you have some servers with modems and you need to make sure that the modems are always taking incoming calls, set up a monitor to trap the message, "remote phone did not answer" so you can track your modem's availability.
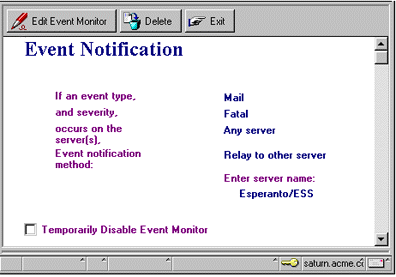
- Suppose you want to keep tabs on your servers' ability to route mail. One way is to create the following Event Monitor document to track the message, "No route found to domain <Domain Name> from server <Server Name> via server <Server Name>. Check Server, Connection and Domain documents in Name & Address Book." Notice that the event type is Mail. The notification method means that all servers in the domain will relay the event, via a network session, to the Statistics database on Esperanto/ESS. We've specified the severity level as Fatal, because when this error occurs, you probably have serious mail routing problems in your domain.
To track other message delivery failures, you can also create monitors for the messages "Error delivering to <Server Name> <Mail File Name>; <Additional Error Information>", "Maximum hop count exceeded. Message probably in a routing loop." , and "Router: Error transferring message <Note ID> to <Database Name> <UNID>".
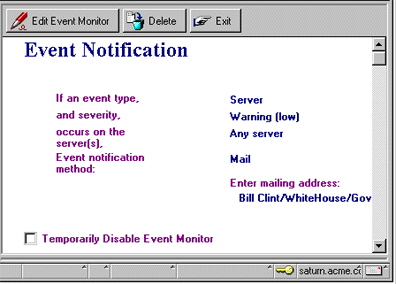
- Suppose you want make sure that agents are running smoothly on your server(s). You can create the following event monitor to track the message, "AMgr: Error processing agent document update or addition," which maps to the Server event type (because the error is related to the Agent Manager server task). We've specified to notify Bill Clinton, via mail, if any Server event of Warning (low) occurs on any server within the domain he administers.
We encourage you to check out the spectrum of messages available for you to trap. To do this, go to the Names & Messages - Messages view, or Messages by Text view, in the Statistics & Events database. The messages range from network-related problems, to replication, security, and as you saw above, mail.
Also, note that you can set up event reporting across multiple domains. Please see the Administration Help for details.
Statistic Monitors
Statistic monitors, which require the Reporter or Collector task, can be another weapon in your arsenal. As with the event monitors, you can receive notification when a particular threshold has been exceeded. Let's say you want to monitor how much free disk space you have on your Notes data drive. Remember you'll probably want to have at least two times the amount of free disk space as the largest Notes database in your data directory (for compacting the database). The following screen shows a Statistic Monitor for monitoring the available disk space on the server Esperanto/ESS.
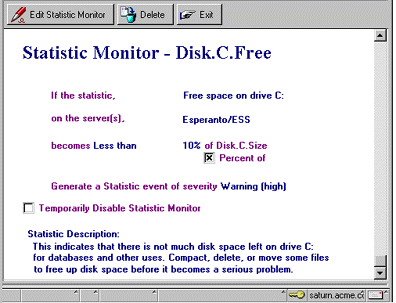
Perhaps you'd like to track the remaining free disk space on a drive to ensure there's plenty of room to plan for swapfile growth. Or perhaps you want to be notified if your mail hub server has more than 5 dead messages in its mail.box; you can set a monitor up for that statistic. Other useful statistics to set thresholds for are replica.failed (to help ensure your replication is working properly), mail.waiting (a consistently high number on this value might indicate a busy server), server.sessions.dropped (another good yardstick to identify busy servers), and mem.free (to make sure you're not going to overrun your available memory).
As we stated with the event monitors, we would encourage you to check out the spectrum of statistics available for you to trap. If you don't see a statistic that you want in the keyword list, go to the Names & Messages - Statistics Names view, open a statistics document in edit mode, and change the value of the field "Is this statistic useful for setting thresholds?" to YES.
Conclusion
Monitoring Domino's statistics and events is a great way to keep in tune with the status of your server. Not only can you use the tools to keep track of various conditions, but you can have early warnings about potential problems by having alarms set, or notifications sent to you. Having this functionality in place frees you up to perform other tasks to keep your system running smoothly.
ABOUT BRIAN
Brian has worked at Lotus since March of 1989, and began doing Notes support in 1993. He currently works in the Field Support Services group, which specializes in rolling out Domino and Notes in large enterprises. Outside of work, Brian plays Ultimate Frisbee on Lotus' Demons team.
|