
 | 

QuickPlace Place Catalog scalability
by
Yuriy
Veytsman


Level: Intermediate
Works with: QuickPlace
Updated: 08/04/2003

Related link:
More Performance Perspectives
| 
 | 
The Place Catalog is an integral component of the QuickPlace architecture. The Place Catalog, introducted in QuickPlace 3.0, is a listing of all Places that currently reside on servers within a QuickPlace service. The Catalog collects data about Places (names, location, members, size) and provides a central control point across multiple QuickPlace servers and clusters. Administrators can use QPTool or an XML interface to the QuickPlace Java XML API to access the Place Catalog to query information. (See the QuickPlace documentation for more information.) And end users can access the Place Catalog indirectly through features such as My Places, allowing them to see and access the Places to which they belong.
As more and more people use QuickPlace, many administrators find themselves managing environments with increasingly large numbers of Places. To help plan for this growth, you need to consider common capacity issues such as disk space management, server speed, and so on. In addition, it's important to know what effect the numbers of Places and users have on the Place Catalog because this (along with other QuickPlace activities) can impact user response time.
To help provide you with this information, we conducted a study in which we measured how the Place Catalog scaled in environments with more users and Places. This article presents the results of this study. Our goal is to help you plan for the smooth growth and maintenance of your own QuickPlace environment, especially in terms of Place Catalog usage. This article assumes that you're an experienced QuickPlace administrator.
Test configuration
In setting up our study, we deliberately avoided using high-end, state-of-the-art systems. Instead, we used medium powered configurations, delivering computing power that can be easily matched or exceeded by most customer environments. This included 500 MHz computers with four CPUs (which we used to take advantage of multi-threading). Also, we assumed that in a typical QuickPlace, 20 percent of the total number of users are performing an activity at any given moment. In other words, if we ran a test with simulated users performing a certain activity, our results would apply to a real-world QuickPlace environment with five times the number of users in our test. Therefore, by determining the maximum number of concurrent lookups at an acceptable level of response time (which we defined as one to three seconds), we can help you plan how to best use the Place Catalog feature at your site.
Hardware/software
The details of our hardware/software setup are as follows:
| QuickPlace server |
- IBM Netfinity 7000 M10 4x550 MHz machine running Windows 2000 with SP3
- 2.3 GB memory
- 330 GB of storage provided by Network Appliance F800 Series
- Domino 5.0.10
- QuickPlace 3.0a server with HotFix 011003
|
| Place Catalog server |
- IBM Netfinity 7000 M10 4x550 MHz machine running Windows 2000 with SP3
- 2.3 GB memory
- 330 GB of storage provided by Network Appliance F800 Series
- Domino 5.0.10
- QuickPlace 3.0a server with HotFix 011003
|
| LDAP server |
- IBM Netfinity 7000 M10 4x550 MHz machine running Windows NT with SP6
- 2.3 GB memory
- Domino 5.0.10 with the LDAP service enabled
|
We set up our configuration using the recommended best practices listed in the QuickPlace documentation. We deleted Placecatalog.nsf from the QuickPlace server and instead pointed the server to the Place Catalog server as the central depository. We also adjusted the QuickPlace configuration file to limit the number of Places displayed on the My Places page to 12.
We populated our LDAP directory with 100 groups, each containing 150 users, for a total of 15,000. Each user belonged to a different organizational unit.
Workload and metrics
As with other studies discussed in this column, our testing involved simulated users. Therefore, our results may not exactly match what customers may experience in their own environments. Further, we focused on specific "stressful" user actions involving the Place Catalog. Our goal was to provide relative results among QuickPlace environments of varying size. We weren't concerned with trying to make our test environment as close as possible to an actual customer environment. Therefore, the important data we derived involves how one environment compared to another, rather than the actual time it took to perform each user action. In typical QuickPlace sites, performance times will likely be faster than what we observed in our study.
We developed our workload with Mercury LoadRunner 7.51. This workload simulated a user doing the following:
- Log in
- "Sleep" for 30 minutes (this allowed us to log in a large number of users)
- Open My Places
- View each page on My Place until the last page appears (the number of pages varied from 9 to 100, for a total of 1,250)
- Log out
As you can see, this is a very focused workload, not meant to simulate a typical QuickPlace user session. In our study, all client-side caching was disabled. We also rebooted servers before each test.
To measure the results of each test, we used LoadRunner to determine how long it took each user to reach the My Places page and how long it took to flip every other page with QuickPlace names. We also used Perfmon to measure CPU, network, memory, and disk I/O usage.
Results
After discussions with the QuickPlace team, we decided to conduct our study in two phases. In the first, we started with 10 users running against 100 Places and gradually increased the number of users to 240. In the second phase, we started with 10 users running against 100 Places and gradually increased the number of Places up to 15,000. In each phase, we monitored the performance of the QuickPlace and Place Catalog servers, as well as user response times. The remainder of this article discusses the results of these tests.
Phase 1: Increasing the number of users
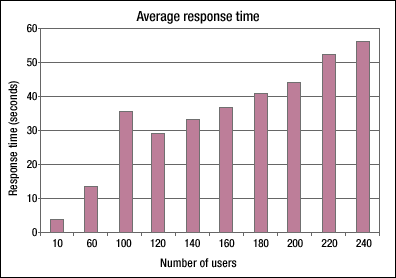
The following results show that increasing the number of users on the same number of QuickPlaces (100) affects QuickPlace server response time. For example, our first illustration shows the general increase of the response time as the number of users increases:
CPU utilization for Phase 1 was relatively stable:
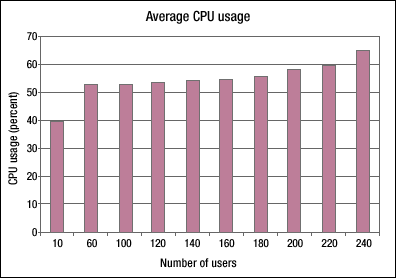
This stability was probably due to the Web caching feature of the QuickPlace 3.0a server. When a user accesses the Place Catalog database (Placecatalog.nsf) on the Place Catalog server, the server pulls all information about QuickPlaces that the user belongs to. This information is then cached on the QuickPlace server. Therefore, increasing the number of users doesn’t affect CPU utilization as much because this information is already available. However, creating and maintaining an individual cache for each user does consume some server resources. For example, the following graph shows CPU usage for 100 users running against 100 Places:
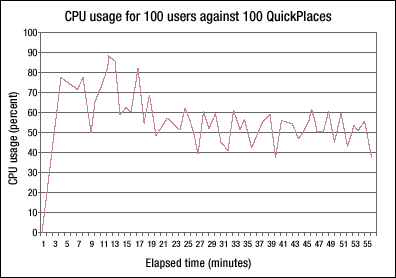
This graph shows CPU usage at the point when 100 users first reach their My Places pages and pulls information from the Place Catalog server. This causes a spike until CPU is 100 percent utilized, after which data is pulled from the server cache to ease CPU load.
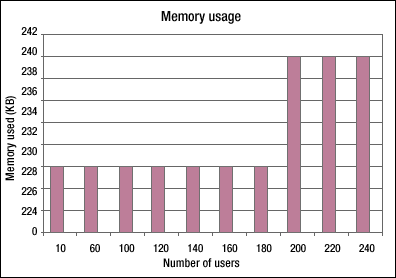
No other significant problems were observed in Phase 1. For example, memory usage was not an issue for our 2.36 GB memory QuickPlace server, even when it jumped from 230 MB to 240 MB at 200 users:
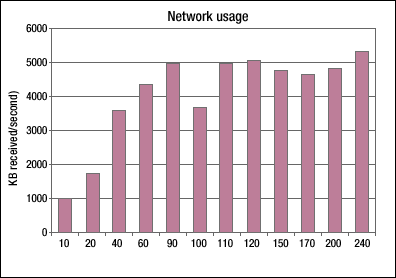
Network utilization was also no problem:
Finally, disk usage remained below three percent in all our test runs and averaged a negligible 0.6 percent:
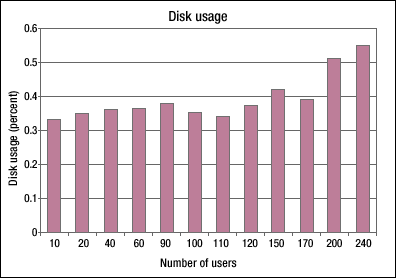
Overall in Phase 1, we found that the number of logged and working users has a major impact on Place Catalog-related activity in QuickPlace. The server has to create individual caches for each user and has to maintain this cache when a user accesses new pages, which puts a load on the server. The Place Catalog server remained fairly stable with overall CPU usage averaging less than one percent and memory usage approximately 250 MB. Network utilization also remained stable.
Phase II: Increasing the number of Places
In the second phase of our study, we ran 10 users against 100 Places and gradually increased the number of Places until we achieved 15,000. And as with Phase 1, we focused primarily on Place Catalog-related activity. We discovered that average response time for 10 logged users working with 15,000 QuickPlaces was much better than with 100 users with 100 QuickPlaces (which we saw in Phase I). The following graph shows response time, which remained below our three-second goal until our 5,000 Place test:
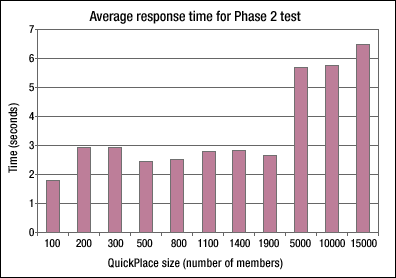
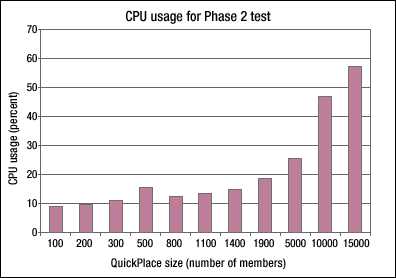
Even at 15,000 users, average response time (while outside our three-second limit of acceptability) was still under seven seconds. CPU usage followed a similar pattern, much lighter for 10 users with many Places than hundreds of users with fewer QuickPlaces:
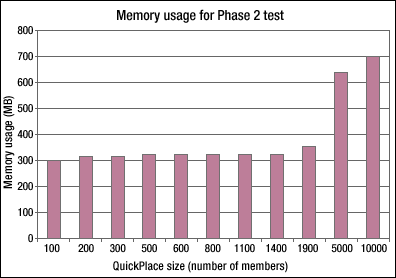
Memory usage suggested that more memory is used to handle larger numbers of Places, and that memory has a tendency to be occupied and stay occupied by cached QuickPlace data:
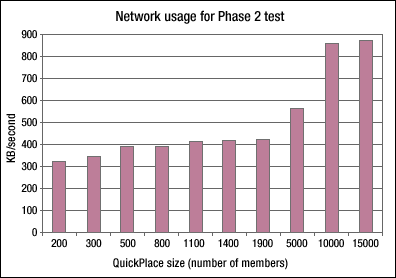
Network and disk usage were negligible. This chart shows network usage:
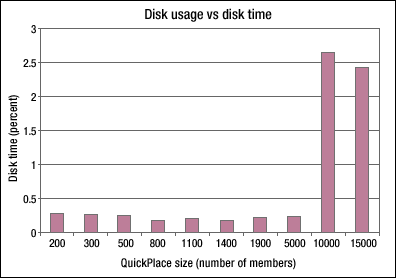
And this chart shows disk usage, which remained lower than three percent:
In the Phase 2 test, we found that the total number of logged users accessing Places had more impact on the server performance than the number of Places users worked against. CPU usage was lower when it created and maintained fewer Places in an individual cache. And more memory was used to cache information for thousands of QuickPlaces.
Overall observations
Although our deliberately underpowered test server showed less than optimal performance handling more than 10 users accessing Places through the Place Catalog (due to the system resources needed to create, maintain, and update an individual cache for each user), our modest 2.3 GB memory was more than sufficient to accommodate 10 users' caches even with 15,000 Places each. Further, these numbers represent simulated users actively performing a high-stress action. In a real-world environment, where only 20 percent of users may be active at any one time, the actual user numbers might typically be larger by a factor of five or more.
Also bear in mind our goal is to show relative scalability rather than absolute, hard-and-fast capacity metrics. Thus, these results are not intended as an example of a typical QuickPlace workload. We do not recommend basing server sizing decisions solely on this report. Instead, use our results as a guideline for the planning around usage of the Place Catalog.
ABOUT THE AUTHOR
Yuriy Veytsman has been a Staff Software Engineer with IBM/Lotus since the late 1990's, working on projects involving iNotes Web Access, Discovery Server, QuickPlace, and Sametime testing, and various other responsibilities. Previously, Yuriy was employed developing a variety of software and hardware applications for numerous companies throughout Europe. | 
 |