 |

Part 3
by Carol Zimmet
and Amy E. Smith


Level: Advanced
Works with: Domino 5.0
Updated: 12/01/2000

Inside this article:
Monitor more than disk I/O metrics
Configuring memory on a partitioned system
You can't always design and code as documented

Related links:
Putting the right spin on Domino server performance (Part 1)
Putting the right spin on Domino server performance (Part 2)
Command Performance 2: The Iris Domino Performance Team (interview)
Lotus IT Central Performance Zone
NotesBench Consortium
Application Development Best Practices Guide
Performance Considerations for Domino Applications

Get the PDF:
 (194 KB) (194 KB)


|  |
This is the third in a series of articles that identifies and clarifies issues and misconceptions that Domino administrators, users, consultants, and Business Partners often confront. These articles discuss concepts, options, and features whose use or non-use has a direct impact on Domino server performance or deployment and capacity-planning decisions. The articles often span multiple feature areas—such as mail delivery, application development techniques, Web-related strategies, and database management and design—and multiple platforms, often making recommendations for specific platforms.
Part 1 of the series looked at clearing up misconceptions and erroneous information being promulgated in the user community about the Domino server, as well as some recent new features that are not yet in widespread use (although they should be). Part 2 discussed some proactive steps that administrators can take to improve system performance, including adjusting system parameters, optimizing user files, and implementing sound application development practices. This third installment provides some new ways to look at the ever popular topic of memory utilization, including how to monitor for low-memory conditions and how to plan for memory allocation in a partitioned configuration. There are also some tips on application design and development for Domino applications.
It's important to note that with this series of articles, the Iris Domino Server Performance Team is attempting to provide performance information for all supported Domino platforms. The team works closely with the platform vendors to get the most accurate information about specific platforms and to gather performance data about how those platforms work with Domino and Notes.
Monitor more than disk I/O metrics on your application servers
Disk I/O metrics are probably the most important statistics to track, as the disk is the system component that appears to be under the most contention, and it is the also hardest one to correct. However, other components, such as CPU, memory, and the network, still need to remain on the administrator's radar.
Memory, in particular, with all the different options for system configuration, is the other component likely to be suspect in an over-utilized system. Many administrators would like to know when a busy server is low on memory and how to detect the condition before it becomes critical. Recently, an administrator asked the Server Performance Team directly about the key indicators for low-memory conditions, how this information would be interpreted, and when to add more memory.
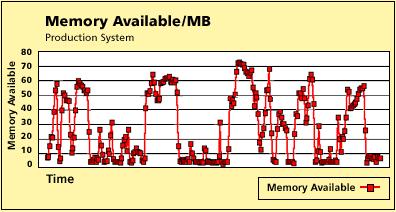
The following charts show data from a customer's production R5 environment. The data in the charts spans a two-hour period (from about 9:30 AM to 11:30 AM) when users were most active. Specific system details are purposely excluded from this discussion, as the focus here is understanding how to deal with detecting and responding to low-memory conditions—a situation that can occur on any system. In this case, the administrator was concerned about which metrics to track in order to monitor the performance of the Domino server.
The production server was an application server that was supporting big databases with a large number of views. There were approximately 70 applications running on this server, and about 5.4 GB of data getting 17,000 uses per week. One application on the server was a 1.9 GB database with 128 views. The server configuration was a Pentium Pro 200, which was originally configured with 256 MB of memory but which had 512 MB of memory at the time of evaluation.
The following chart shows the amount of memory available, in MB, for this application server, sampled over the two-hour period. The average memory available is about 28 MB, which is a borderline case considering that the system has 512 MB. At times, the memory dips to less than 5 MB available, which is disconcerting, especially as this occurred about 23 percent of the time. These two analysis points, both individually and together, signal a condition that needs to be addressed on this server.
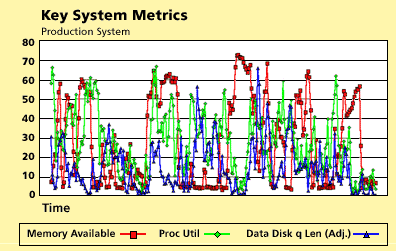
Of course, other key system factors should be reviewed at the same time. During the same two-hour sampling period, CPU utilization stayed within a reasonable range, with an average of 27.9 percent and a peak at 66.7 percent. Disk I/O metrics for the data drive showed more stress—an average disk queue length of 1.48, peaking at 6.59, and the percent disk time busy reading and writing average at 77.76 percent with a peak at 100 percent. (See Part 2 of this series for more information about disk queue length.)
The following chart displays processor, memory, and disk information, which lets you see when the peaks occur and how long they are sustained so that you can try and associate the system behavior at that time with what is causing the impact. (Note that the average disk queue length information in this chart is adjusted by a factor of 10 for better visual effect.)
To put system metrics in better perspective, and to properly evaluate the information provided, the Server Performance Team posed the following questions to the Domino administrator:
- Are any other active non-Domino applications on this drive?
- Are there any other Domino tasks executing at a high activity level?
- What are the number of disk spindles? (This information is needed to correctly analyze the disk queue length, as described below.)
Although finding the number of disk spindles is a challenge on some platforms, it is important to know such system configuration information. You cannot review the disk queue length information in isolation but must review it in conjunction with the number of disk spindles for your configuration. To determine if you have a saturated disk configuration, see if your average disk queue length exceeds the number of spindles; if so, you are running into a disk saturation situation. The larger the difference between the value for disk queue length and the number of spindles in your disk configuration, the greater the magnitude of the problem. The Server Performance Team has also found from general experience, that the average disk queue length provides a better granular indicator of disk utilization levels. Other metrics, such as service time or percent disk busy time, are equally useful on other platforms.
The disk metrics from the previous chart were broken out in a separate chart for easier viewing. The chart below shows the data for the disk I/O. (Note that the data was normalized for the disk queue length for better visual effect.)
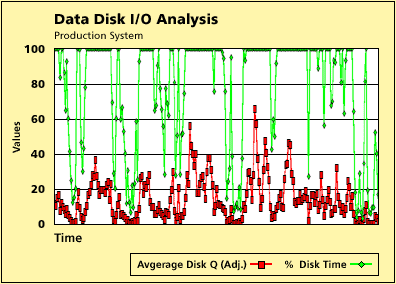
When this analysis was originally done, the number of spindles weren't available; however, we can analyze from a theoretical viewpoint. The algorithm for evaluating an I/O bottleneck for most cases is to divide the average disk queue length by the number of spindles, and analyze the result. If the resulting number is greater than 1, there is an area of further investigation. So in the example above, if the number of spindles is equal to 4, where the average is less than 4, this system is probably not disk I/O bound. If the number of spindles is equal to 2, then this configuration would be closer to an I/O-bound condition. You can factor in the percent disk time value (which, by experience, has been less granular in giving an accurate indication of disk saturation on this platform), and since it is the range of 100 percent a good deal of the time, it appears this system might warrant more analysis of its disk I/O configuration.
Note: There are disk configurations that don't report disk spindle information in the context in which it is used above. In those cases, you should work with the disk manufacturer to relate your disk configuration to the average disk queue length metric.
Note: The analysis of the metrics above are NT/Win2000-centric. Every platform provides its own metrics for analyzing disk saturation conditions. The individual vendors and the information they post on their Web sites should help guide you through the analysis process. The platform stats are being developed with this strategy in mind and include these important platform-specific metrics, so that this level of analysis can be done through Domino statistics.
Getting back to the questions raised by the Domino administrator, we ordinarily recommend that at an absolute minimum, the amount of available memory should be greater than 4 MB. However, if there is less than approximately 5 percent of memory available, administrators should do some analysis and planning for that server, with the goal of taking some corrective action in the near future. This is a value you can set as a threshold within Stats & Events to generate a warning when the amount of available memory dips below this value. The first chart showed a Domino server that has an average of 28 MB of memory available, which translates to a definite warning condition. We believe the operating system logic will protect itself by reserving the last 4 MB or so for its use, which is why you don't typically see available memory dipping below that value.
Monitoring for low-memory conditions isn't required as often on larger scale machines, as the base memory configurations for these machines are also larger scale. The Server Performance Team has run into some situations in performance benchmark efforts (on a UNIX system, for example), where the system was paging heavily and the page scan rates (sr column in vmstat) increased significantly because of file system paging, not Domino paging. The file system paging rate was in the thousands. In this situation, additional memory would have helped. When the Performance Team monitors available memory on a UNIX system, using the output from vmstat, the information in "swap" indicates the amount of swap space currently available in KB. Additionally, vmstat lists the size of the free list in KB under the "free" column.
Note: See the table later in this section, which describes the platform statistics available through Domino for memory monitoring.
Platform statistic collection is a Domino server-level enhancement that was introduced in Domino Release 5.0.2 for NT and Solaris/UNIX, and Domino Release 5.0.3 for AS/400. It currently runs on NT, IBM AS/400 (iServer 400), and Solaris/UNIX platforms, and requires that the NOTES.INI setting Platform_Statistics_Enabled=1 be set before the Domino server is started. The statistics include information about the underlying platform characteristics (processor, memory, and disk I/O). It's important for Domino administrators to be aware of this variable and to enable it for their servers.
As a result of enabling platform statistics, Domino statistics include a new metric—Platform.Memory.KBFree. If the Stats & Events environment is configured and running, administrators can set a threshold for notification when the value for this metric falls below a given range—for example, set to 10, as the Domino stat is reporting information in units of KB, or set to equal approximately 5 percent as a warning, as recommended earlier. The administrator is then notified when the low-memory conditions are reached on the server.
Administrators now have a nice toolbox for tracking available memory on their servers; it includes the metric to monitor (Platform.Memory.KBFree); threshold values for red (less than 10 MB, for example) and yellow (less than 28 MB, for example) memory conditions; and a process for notification in the event of a low-memory situation.
Note: For the AS/400 platform (because of the single-level store), IBM recommends the use of different metrics: Platform.Memory.FaultsPerSec and Platform.Memory.WaitToIneligible.
You no longer have to monitor the other metrics through the individual Platform Performance tools. The Domino server Platform statistics now can help you do the monitoring from one interface. The following table reveals which Platform statistics should be specifically monitored. Note that the table below represents a subset of the Platform statistics supported by the Domino server.
Performance Metric
(by System Component) | Description |
| Memory |  |
| Platform.Memory.KBFree | Amount of virtual memory (in KB) available on the system. Equivalent to Memory/AvailableBytes in Windows NT Performance Monitor, divided by 1024. |
Platform.Memory.FaultsPerSec
(AS400 only) | Number of page faults per second in the memory pool the server is using. |
Platform.Memory.WaitToIneligible
(AS400 only) | Number of Wait to Ineligible transitions for threads in the memory pool this server is using. Any value greater than zero indicates the max active in the memory pool is too low. |
| CPU | |
| Platform.System.TotalUtil | Average percent CPU utilization of all CPUs on the system. Equivalent to System/% Total Processor Time in NT Perfmon. |
| Platform.System.TotalPrivUtil | Average percent CPU utilization in privileged mode of all CPUs on the system. Equivalent to System/% Total Privileged Time in NT Perfmon. |
| Platform.System.TotalUserUtil | Average percent CPU utilization in user mode of all CPUs on the system. Equivalent to System/% Total User Time in NT Perfmon. |
| Disk | |
Platform.LogicalDisk._Total.1._Total
.1.PctTime | Percentage of the sampling interval that all logical disks on all physical disks are servicing read or write requests. Equivalent to LogicalDisk/% Disk Time in NT Perfmon. First "_Total" refers to all physical disks; second "_Total" refers to all logical disks. |
Platform.LogicalDisk._Total.1._Total
.1.AvgQueueLength
(NT only) | Average number of both read and write requests that were queued for all logical disks on all physical disks during the sample interval. Equivalent to LogicalDisk/Avg. Disk Queue Length in NT Perfmon. |
Platform.LogicalDisk._Total.1._Total
.1.ServiceTime
(Solaris/UNIX only) | Amount of time in milliseconds for a read or write command to complete. |
The ultimate goal for administrators is to define the boundary conditions for redistributing load or adding memory. The metric to be monitoring in this case is Platform.Memory.KBFree. The best recommendation is to:
- Note the minimum amount of memory that should be left remaining on your system and the total amount of memory available.
- Factor in the partition configuration.
- Gauge your memory usage level.
- Then reserve at least 10 percent as a safety net.
In this sample case, the win for the Domino administrator was understanding the implications of having only 4 to 5 MB memory free at times, and how this indicates a low-memory situation. The other win for this Domino administrator was learning how to better interpret the average disk queue length metric and understanding how important it is to factor the number of disk spindles into the analysis to determine if there is a disk bottleneck situation.
With the base memory at 512 MB, the administrator was advised to grow the system by adding additional memory, based on the amount of time spent in low-memory available situations and the administrator's plans for future growth. In previous discussions, the administrator did not want to change the current architecture or design, or the number and type of applications running on the server—both possible solutions to relieving a memory intensive situation. Specifically, the Server Performance Team recommended incrementing memory by 256 MB or higher, given current memory pricing and the typical ease involved with upgrading memory.
To better understand how Domino uses available memory for its various processes, you should check out Inside Notes, which contains information about the architecture of Notes and the Domino server. For an example of a customer who maintains a large number of Domino servers, see the Lotus IT Central Performance Zone article "Acxiom Corporation: Upgrade to Notes and Domino Release 5 Nets Improved Productivity, Performance, Hardware Consolidation for Acxiom."
What you should know about configuring memory for a partitioned system
Once users understand what can be done on a single-partition system, they often want to explore the possibility of implementing multiple partitions on a single system. As a result, the Server Performance Team is frequently asked about server physical memory and how much of it Domino can use. The answer is complicated, however, by the fact that you must also understand the importance of the operating system (OS) because system applications are limited by what the OS supports. And, while it is possible to implement more hardware than applications can actually use, "creative configuring," which may include OS options and/or partitioning design, is still required for effective memory usage.
Partitioning allows multiple instances of Domino to coexist on a single system. It lets you:
- Fully leverage the capabilities of a large-scale system
- Leverage specialized features of Domino (as opposed to using all the system capabilities)
- Plan for different user activities or different user profiles
- Migrate multiple separate servers onto one system, as part of a server consolidation strategy, while still retaining the system's original identity
Part 1 of this series discussed planning for use of available memory in a single partitioned configuration. We'll build on that information now, with a discussion of memory analysis for partitioned configurations. To recap, the Domino server makes decisions about memory allocation for buffers and active processes, based on the amount of available memory. Generally, more is better, but in this case, more is better only up to a point. When planning for the use of available memory, you must consider:
- The amount of memory available
- The platform and operating system in question
- The build level of the application (32 bit vs. 64 bit)
- The addressing level supported by the OS (32 bit vs. 64 bit)
Planning for partitioned configurations adds a level of complexity, as you must also factor in what the partition goals are and whether the platform and/or configuration can support those requirements. For example, users must consider if the OS is supporting 32-bit or 64-bit (for example, Solaris/UNIX, AS/400, and RS/6000/AIX support 64-bit operating systems). For the 64-bit OS versions, users need to know if the application is built to support 64-bit addressing.
For certain operating systems, additional system memory provides no benefits at all, as there is an upper limit to the available memory that can be effectively used by the operating system kernel. The decision to partition a given configuration, then, is based on reasons other than using extra available memory. The following are some guidelines that will help administrators plan for the maximum amount of memory that can be effectively utilized on their systems, as is the case for the 32-bit versions of the operating systems.
The use of additional memory is platform-dependent, so each platform and release level needs to be reviewed independently. As described earlier, one of the analysis points is to determine whether the operating system supports 32-bit or 64-bit addressing. For example, some varieties of UNIX can use more than 4 GB memory by running multiple instances of the operating system. However, 64-bit operating systems such as Solaris/UNIX can address much more memory. Domino R5, while a 32-bit application, is currently supported on Solaris's 64-bit version as a 32-bit application.
These calculations are based on the premise that the Domino server is a 32-bit application. The maximum amount of memory that a 32-bit operating system can address is 4 GB. This is typically divided into 2 by 2 GB areas; one 2 GB section is allocated to applications and the other 2 GB section is reserved for the operating system. Note that this rule of thumb applies to the majority of the Microsoft operating system releases. The following sections provide more detail about what various operating systems can support.
In recent months, the Server Performance Team has seen more 64-bit operating systems being released from the platform vendors. The following are some considerations to keep in mind when implementing multiple partitioning on such configurations:
- When Domino executes on a 64-bit operating system, it still has boundaries for configuring the internal caches and data structures to the limits described below, because it is still executing as a 32-bit application.
- When configuring multiple versions of Domino on a 64-bit OS, it is possible to reduce contention situations, such as for semaphores. Consequently, there is better utilization of the system configuration when there are multiple instances installed, because of the distribution of Domino related resources and availability of multiple concurrent instances executing.
Note: For all the platforms listed below, the analysis is based on a multiple partitioned configuration.
Windows NT - Standard Edition
In a single-partition system, Domino can address up to a 2 GB physical memory limit. If there is additional memory on the system (for example, if it is a 3 GB system), we have observed that up to approximately 2.6 GB can be used. In these cases, the .6 GB are used by the operating system and 2 GB are used by Domino. For multiple partitions in which the server configuration has more than 2 GB memory, the Domino partitions will divide up the memory used within the addressable 2 GB range. For example, for two partitions, the total maximum addressable is still 2 GB; Domino can only address 1 GB in each partition, for a maximum of 2 GB. So in this case, extra memory won't help.
Windows NT - Enterprise Edition
The Enterprise Edition of NT supports the ability for Domino to access 3 GB of physical memory. To enable this, you must boot NT Enterprise Edition (NT EE) with the /3 GB switch. This changes how memory is allocated, from 2 GB for Domino and 2 GB for NT, to 3 GB for the application and 1 GB for NT. To take advantage of this option, Domino needs to be built specially. However, internal tests run by Iris indicate that the extra memory does not provide any performance or scalability benefits for our different workloads at this time. Therefore, the /3GB option will be reviewed periodically to see if there are gains with the newer release; but for all intents and purposes, for the Enterprise Edition of NT, Domino can address up to a 2 GB physical memory limit. In other words, the maximum memory addressable by Domino is the same as that for Windows NT Standard Edition.
Additionally, NT EE's 192 MB kernel-paged memory is a limiting factor. See the Lotus Customer Support Technote #179781, "Domino R5 on NT Returns: Insufficient System Resources Exist to Complete the Requested Service" for more information.
Windows 2000 - Server Edition
With Windows 2000 - Server Edition, Domino can address up to a 2 GB physical memory limit, just as it can for NT. If there is additional memory on the system (for example, if it is a 3 GB system), we have observed that up to approximately 2.6 GB can be used. In these cases, the .6 GB are used by the operating system and 2 GB are used by Domino. 2 GB is still the total maximum addressable by Domino on a Windows 2000 server configuration.
Windows 2000 - Advanced Server Edition
With Windows 2000 - Advanced Server Edition, Domino can address up to a 2 GB physical memory limit, just as it can for NT. If there is additional memory on the system (for example, if it is a 3 GB system), we have observed that up to approximately 2.6 GB can be used. In these cases, the .6 GB are used by the operating system and 2 GB are used by Domino. 2 GB is still the total maximum addressable by Domino on a Windows 2000 server configuration.
This edition also supports the /3 GB switch, where an application could take advantage of additional physical memory, if specially built. Again, internal tests do not show that extra memory provides any performance or scalability benefits for different workloads. Currently, for this version of Windows 2000, Domino can address up to a 2 GB physical memory limit. Windows 2000 has doubled many of the OS memory pools, so the problem mentioned above with NT kernel paged memory should not be a problem in Windows 2000. In conclusion, this configuration works as described for the Windows 2000 - Standard Edition in terms of Domino addressable memory.
Windows 2000 - Data Center Edition
OS partitioning in the Windows 2000 Data Center depends on the Intel system vendor. This Windows product is still new to the market and not generally available. Compaq and Unisys are currently the only vendors of which we are aware that offer OS partitioning under Data Center.
Solaris/UNIX
With Solaris/UNIX, Domino can address up to 4 GB of physical memory on the 32-bit version of the operating system. Some of this physical memory is also used by the kernel.
The Solaris kernel in the 64-bit version of the OS can address more than 4 GB of physical memory. Even though Domino can still only address 4 GB of memory, the OS kernel can address remaining extra memory and use it for OS level operations (such as filesystem I/O). In conclusion, there's not as much focus on OS partitioning when dealing with 64-bit operating systems, as the remaining memory can be used. There can be multiple Domino partitions configured on the system, addressing up to a maximum of 4 GB of memory, where Domino is running as a 32-bit application.
RS600/AIX/UNIX
WIth RS600/AIX/UNIX, Domino can address up to 4 GB of physical memory on the 32-bit version of the operating system. Some of this physical memory is used by the kernel. Starting with release versions AIX 4.3.3 and higher, the AIX kernel supports 64-bit addressing, and thus can address up to 64 GB easily. The upper limit for supported memory on AIX will be increased.
Even though Domino can still only address 4 GB memory, the OS kernel can address remaining extra memory and use it for OS level operations (such as file system I/O). In conclusion, there's not as much focus on OS partitioning when dealing with 64-bit operating systems, as the remaining memory can be used. There can be multiple Domino partitions configured on the system, addressing up to a maximum of 4 GB of memory, where Domino is running as a 32-bit application.
AS/400
OS/400 memory management is handled somewhat differently. OS/400 is a 64-bit operating system. It can support up to 96 GB of primary memory (or optionally to 128 GB). It can also support up to 2000 TB of secondary memory (disk), although individual files may not exceed 64 GB. OS/400's single-level storage management allows addressing above 96 GB.
Normally you can have up to 99 Domino servers on OS/400. It is also possible to divide an OS/400 machine into Logical Partitions (LPAR's). Each LPAR can run 99 Domino servers. The current limit to the number of LPARs is equal to the number of processors; thus currently you can have a maximum of 24 LPARs. Multiply that by 99, and you have the possibility of 2,376 Domino servers on one box!
Each Domino partition can address any part of memory storage; the OS decides whether that's in memory or disk. For example, you can have one partition using all 2000 TB, or one partition using 5 plus a second using 1995, and so on. The only storage not available to Domino is the small amount used by the OS.
For more information, you can refer to several articles on the AS/400 IBM Web site; in particular, see the articles "Improve the return on your IT investment with Server consolidation" and "Domino on the AS/400."
S/390
For an OS/390 environment available today, a single Domino partition can address up to 2 GB of memory. Multiple Domino partitions can run on a single OS/390 instance (LPAR) as long as the total memory requirements for all partitions don't exceed 2 GB. Each partitioned server that requires 2 GB needs to be placed in a separate OS/390 LPAR. Up to 15 OS/390 LPARs may be supported on a single piece of S/390 hardware
The new zSeries 900 (the follow-on to the current S/390 product line) offers 64-bit real memory addressability. Each LPAR supports up to 64 GB of real memory, although the Domino server itself continues to live within a 2 GB address space. This means that all Domino partitions that can be spread across multiple OS/390 LPARs today can be consolidated to a single z/OS LPAR.
Note: An essential aspect of configuring memory is knowing when and how to set the appropriate NOTES.INI variables to properly determine available memory. Traditionally, this variable was NSF_Buffer_Pool_Size. However, we strongly recommended that PercentAvailSysResources, introduced in Domino 5.0.4, should be used for this purpose for systems with 5.0.4 and higher, instead of the NSF_Buffer_Pool_Size setting. This value needs to be monitored over time, and especially after any hardware or software configuration changes. (See the Domino 5.0.4 Release Notes and the Iris Today, Ask Professor INI column "Managing memory allocation using NOTES.INI variables" for more details on using PercentAvailSysResources.)
You can't always design and code as documented in the user manuals
We know this philosophy is contrary to what you've tried to accomplish for many years when attending academic sessions and reading technical literature. You believe that, if you follow all the proper practices promoted in lectures or technical courses and conferences, your application will turn out perfectly. However, being a "purist" in your development approach doesn't always lead to an application that performs well and that supports hundreds of users. It's time to put a new spin on the approach to developing successful (that is, scalable and higher performing) applications.
Two specific examples come to mind, which have come out of meetings the Server Performance Team has had with customer application developers.
Field types: An important design decision to make
When defining field types, it is important to consider the implications of what each type can support and the resulting overhead needed to accomplish that. In this section, we concentrate on the use of Text and Rich Text fields.
The Rich Text field type is the slowest type of field for an application to support, because of the additional features it has, including fonts, attachments, formatting, and so on. Thus, the goal is to minimize the use of this field type. This may lead to some extra coding, but in cases where there are a large number of rich text fields used, trying some new approaches to field manipulation may result in some additional performance benefits.
Here are some observations about using Text and Rich Text fields:
- It can be better to build the text content "off-line" by using an intermediary text buffer. This can be accomplished by using the Text field type and then converting to the Rich Text type when needed. This eliminates the overhead of supporting the Rich Text field as long as possible.
- Use something else besides Rich Text if at all possible; don't default to start using a field definition as Rich Text.
- When performing text field manipulation, it is better to add strings together rather than append a string onto a text field, because the append function will re-read the string from the beginning.
- The Server Performance Team recently helped in a customer situation where the customer was using Rich Text fields, although not necessarily to their advantage. They used the append text methods to build the page. On the surface, this might work well, but investigation showed that they were calling the append text function many times to build the line; and since the logic was encased in logic to put the page together on a line-by-line basis, they would call the append text method many times to put the lines together to build the page. You know how those nested loops can translate to lots of iterations over the same section of code, which can be very scary as the number of users scale. Better buffering strategies should be used to be able to display the page in a much more reasonable time frame.
According to Lotus Professional Services, Rich Text fields might also work to your advantage. Because applications are being developed to use simple Text fields, and to use fewer Rich Text fields, an additional burden might be placed on your server because of indexing slowdowns. As Rich Text fields are not indexed, use of this field type would relieve some potential system overhead consumption.
In conclusion, the primary recommendation here is to take a step back and analyze the implications of what may be going on behind the scenes. That additional insight might lead you to develop in ways that aren't as traditional, but present better application results.
Script libraries
The Server Performance Team has been consulted a few times at conferences and through the Notes.net forums about script libraries. One of the main reasons for using script libraries is that they allow you to make your code more re-usable within an application. They also function as a central location where the Notes client and Web-based applications can gain access to common logic. Conversely, the team is not aware of any limitations to the size to which script libraries can grow, and this is where application developers can run into problems. We've seen situations where script libraries have grown to be 1 MB in size. This is a concern, especially if the script library is accessed frequently, and the logic is not cached. For example, in the case of an agent that uses a script library, every time the agent executes, the 1 MB script library will be loaded. One way to deal with this is to break up the script library into multiple smaller script libraries, and then group commonly-used features together.
You can determine the size of your script library while in the design view, by checking the properties of the Design Document (the Script library) Info tab. This will show the size of the libraries. Specifically:
- To see the total byte size of a script library, check Design Properties - Size.
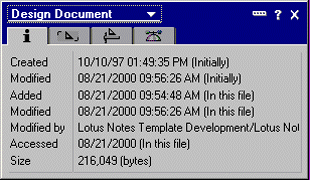
- To get total source size, add the DataLength values for all $ScriptLib fields. (Each such field can hold about 64K minus some overhead, or about 61,310 bytes in R5.)

- To get total LS Object size, add the DataLength values for all $ScriptLib_O fields. Again, each can hold about 64K.

The Server Performance team has been asked to give an estimate as to what maximum size for script libraries should be. This type of question is akin to the question we are often asked about view design. The answer is that script library size is system and usage dependent. While script libraries that are not loaded frequently can be "larger," it's wise to keep them as small as possible, and use multiple libraries, when loaded frequently. The Server Team hasn't done specific studies in this area; this information is based on development experience sufficient to make recommendations and highlight the issue.
See also the article "Code for Better Performance" in the September 2000 edition of Lotus Notes & Domino Advisor Magazine. The author, Matt Holthe, provides some new strategies and tips for Notes application development.
Application development: Advice and practical insights
Lotus Professional Services also offered the following insights, based on their review of many different customer applications:
- Analyze the frequency of write operations performed, and try to do them as infrequently as possible. Following the theme of this section, you might want to find creative ways to design output fields and documents, so as to group the write operations. Calculations should be done in memory where possible, and then issue the write at the appropriate endpoint.
- On the read path, try to read once, and then manipulate the variables in memory. This also is a case where a single read might then be broken up into multiple pieces and manipulated in memory.
Another good reference source is the Application Development Best Practices Guide, a book devoted to optimizing the database design of a database.
So in summary, it's important to review your application code flow and architecture, while keeping in mind the processing that might be taking place behind the scenes. It's also important to be open to using development application methods that, while seeming to circumvent traditional coding practices, can actually lead to performance and scalability improvements.
Conclusion
In this article, Domino administrators are provided with some concrete tools for managing server performance, tools that help them take small steps in improving their server performance. Monitoring memory utilization and having information reported is key, as is the need for administrators to understand how different server platforms allocate memory in multiple-partition configurations. Lastly, the article emphasizes the need look at application development from a different perspective, and rethink the habit of coding "by the book." It offers some specific tips to improve application development by minimizing the impact of such server-intensive elements as Rich Text fields and script libraries.
For additional information on server performance, see the NotesBench Consortium and the Lotus IT Central Performance Zone.
If you have benefitted from any of the tips or information presented in this series, the Domino Server Performance Team would like to hear from you. Send your success stories using the article feedback form. We've already heard from a number of users; your feedback—praise, constructive criticism, and suggestions for future topics—is keeping this article series going.
ACKNOWLEDGEMENTS
Special thanks to the various individuals and teams that have contributed their insights and datapoints to make this article more successful. In particular, the Iris Server Performance Team, the Lotus Professional Services Technology Team, and James Grigsby have all made valuable contributions to the content in these articles. Thanks also go to all platform vendors who generously shared information and time for this article.
ABOUT THE AUTHORS
Carol Zimmet started working at Iris in 1994. She is the co-lead on the Domino Performance Team, and responsible for evaluating performance and performance tool development. Carol continues to search for the one-step solution to everyone's performance problems. She is also interested in a "white box" approach towards improving the quality of the product. Carol enjoys bicycling with her kids and playing racquetball. She has a longing to return to stained glass!
Amy E. Smith is a principal user assistance writer for Lotus. She writes and maintains functional specs for Domino and Notes. She also is a member of the Notes UA Web team. |