
 |

Comparing QuickPlace 3.0 with QuickPlace 2.0.8
by Dick McCarrick,
Jack Williams,
and Yuriy Veytsman


Level: All
Works with: QuickPlace
Updated: 09/03/2002
Related link:
More Performance Perspectives
|
|
Faster and better—that's the goal of every software product. In this month's LDD Today article "New features in QuickPlace 3.0," we list all the new features that make QuickPlace 3.0 a richer, better product than its predecessor, QuickPlace 2.0.8. But is it faster?
To help determine the answer to this question, the Lotus Product Introduction Engineering team conducted a detailed study that compared QuickPlace 3.0 performance to 2.0.8. In this study, we employed tools that simulated typical user workloads at real-world customer sites, performing routine QuickPlace tasks such as logging in, searching a Place, and so on. In the end, we determined QuickPlace 3.0 performance is indeed significantly faster than QuickPlace 2.0.8—so much so, we're confident QuickPlace 3.0 has the potential to signifiantly reduce your total cost of ownership because you'll be able to support larger numbers of users on each server.
This article explains how we arrived at this conclusion. We describe our test setup, list the results we obtained, and examine what they mean. We also take a look at Web caching, a new performance feature that in most cases can further improve response time for QuickPlace. We'll talk about how caching works, which situations it's suited for (and which ones it may not be), and how you can monitor cache utilization at your own site.
Throughout this study we took great pains to ensure our test environment was as realistic and meaningful as possible. At the same time, please be aware no test, however carefully executed, can fully duplicate every possible customer site. Our results are valid and useful for comparison purposes, but they don't guarantee your numbers will exactly match ours.
This article assumes you're an experienced QuickPlace administrator.
Test setup...
To simulate the workload of a population of users, we used LoadRunner 7.0.2, a performance-testing product offered by Mercury International. LoadRunner is a load testing tool for estimating system performance. It allows testers to emulate thousands of active users and includes monitors to record performance figures and trends.
Using LoadRunner, we developed load scripts that simulated various numbers of users performing typical QuickPlace tasks. The LoadRunner drivers executing these scripts resided on two separate PCs. To help ensure the results were as realistic as possible, we ran the scripts against a test set of 100 Places. These Places employed the full range of QuickPlace functionality. (If you have access to LoadRunner 7.0.2, you can download the script file we used from the Sandbox. This file includes explanatory text to help you test the performance of your own QuickPlace site.)
To compare QuickPlace performance, we loaded this set of Places onto two servers. One server ran QuickPlace 2.0.8 on top of Domino 5.0.8. The other ran a pre-release version of QuickPlace 3.0 on top of Domino 5.0.10. Both servers were configured as recommended by the QuickPlace documentation. Our test included a separate directory server, running a Domino LDAP directory. This was a large (2 GB) directory that was modelled after one used by an actual customer. All servers involved in this test were Netfinity 7000 M10 computers and included the following specifications:
| Processor type | PIII |
| Number of processors | 4 |
| Processor speed | 550Mhz |
| Memory | 2.3Gb |
| Disk (onboard) | 4/18.2Gb |
The tests we ran performed the following user actions on our Places:
- Login
- Read attachment
- Read page in Table of Content
- Read last page in a folder
- Read first page in a folder
- Open Calendar
- Search
- Open Task list
- Open page in room
- Navigate to folder
- Create new page
In our tests, we imitated a worst-case scenario where users performed all of the listed action 100 percent of the time. In other words, every time one of our mythical users logged into a Place, they performed all the actions above. This allowed us to maximize the stress on our servers, but of course, it is a less than realistic model of how real users work in QuickPlace. In subsequent tests (the results of which we plan to publish in an update to this article), we will use a more real-world model to more closely simulate actual usage. For instance, during a test run, users will open an attachment in a document 50 percent of the time,or create a new document 30 percent of the time, and so on.
The numbers we obtained in our study, which we discuss in the next section, are based on tests run with anonymous users, representing Places used as Web sites or file stores. We also did some preliminary tests with authenticated users (so their credentials were checked against the LDAP directory), resulting in some significant differences in performance (with implications for Web caching). We recognize most sites using Places internally will employ user authentication; we are in the process of obtaining complete numbers with authenticated users and will publish the results in the future.
...and results
As we mentioned in the beginning of this article, our test indicated QuickPlace 3.0 offers significantly faster average user response time than QuickPlace 2.0.8. This is especially true when larger numbers of users are simultaneously in a Place. At the same time, we did discover some interesting statistics involving authenticating users, login, and caching. In this section, we'll look at the overall results, then drill down a bit deeper to show you areas you may want to consider when determining how QuickPlace 3.0 might perform at your site.
QuickPlace 3.0: significantly faster overall
Perhaps the clearest indication of the difference between QuickPlace 3.0 and 2.0.8 response is the following graph, which shows the average response time for a single user action in a Place using anonymous login:
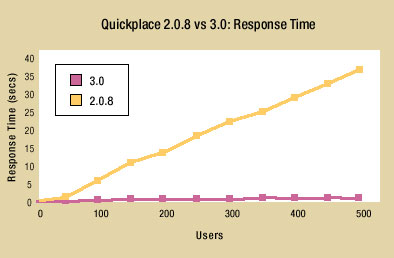
In this graph, average response time is plotted in the vertical axis, and the number of users is plotted on the horizontal. The purple (bottom) line shows QuickPlace 3.0 results, and the yellow (top) line represents QuickPlace 2.0.8. As you can see, QuickPlace 3.0 performance remained fast even when the workload approached 500 concurrent users. The average response time for a single user action remained well below five seconds (our performance goal for QuickPlace 3.0). In contrast, QuickPlace 2.0.8 response time began to deteriorate when the user community exceeded 100, and continued to do so as the user population grew. As a result, in this test, QuickPlace 3.0 performed more than 20 times faster than 2.0.8. as the number of simultaneous users approached 400. Clearly this is a very significant performance improvement, which should be readily apparent to users, especially in particularly active Places.
There are two things to consider when reviewing the preceding graph:
- This graph shows response time for a typical user action. To calculate this, we averaged the response times for all the individual tasks we listed earlier (login, search, and so on). The response time for each individual task, however, varied from task to task. Thus the difference between QuickPlace 3.0 and 2.0.8 was more significant for some tasks than others. We'll talk about this more when we examine individual task performance in detail in the next section.
- All users in this test were anonymous. We did this to ensure both servers performed at peak speed. This significantly reduced login time, because the servers didn't have to perform lookups in the LDAP directory to confirm the identity of each user. This also allowed QuickPlace 3.0 to take full advantage of caching, as we explain later in this article.
Next, we compared QuickPlace 3.0 and 2.0.8 server performance in terms of how many hits per second each could handle:
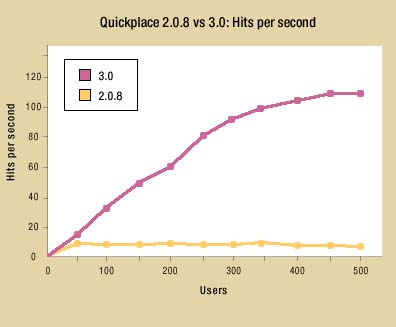
This chart shows that QuickPlace 2.0.8 reached a plateau around 12 hits per second. This was the maximum number of user requests per second QuickPlace could handle, irrespective of how many concurrent users were in the Place. This could have a noticeable impact on response time in heavily used Places, as more and more users compete for the server's limited capacity to handle their requests. QuickPlace 3.0, on the other hand, continued to process hits at a higher rate as the user population grew. As we approached the maximum size of our simulated community, QuickPlace 3.0 was handling almost 10 times as many hits per second as 2.0.8.
We also examined server throughput, how much data each server could process per second:
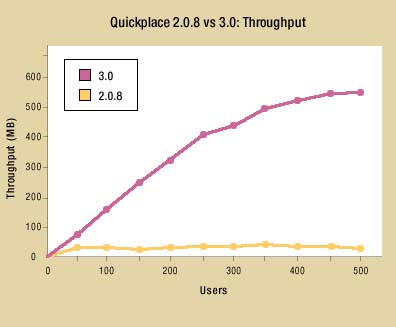
Again, QuickPlace 2.0.8 hit a performance plateau when the number of concurrent users reached a critical size, while QuickPlace 3.0 continued to process data at an ever-increasing rate. As the user community in our test approached maximum size, QuickPlace 3.0 server throughput was about 10 times that of 2.0.8.
Overall, these results strongly demonstrate QuickPlace 3.0 offers significantly improved response and performance over 2.0.8. But to get a fuller picture of "the numbers behind the numbers," we'll now examine our figures in more detail.
Login and other user actions
When we looked closely at our numbers, we discovered (as expected) not all user actions required as much computer time as others. Among the activities we tested, the following five took the longest, listed in descending order:
- Login
- Open Calendar
- Open Task list
- Read page in Table of Contents (Notes format)
- Read page in Table of Contents (Web format)
As you can see, the task requiring the most time to complete is when a user logs into the Place. In fact, when we ran a test with authenticated users, login required slightly more time in QuickPlace 3.0 than in 2.0.8. This result may have been skewed somewhat by the fact that we were using a pre-release version of QuickPlace 3.0. Another factor to consider is the exceptionally large LDAP directory we used, which caused longer name lookup times than may be experienced at a more typical site. Nevertheless, our study showed login is the most "expensive" user action, and authentication adds considerable time to the process. (On the bright side, logging in is something the user typically does only once per session.)
Authentication also plays a role in how efficiently Web caching performs, which we'll look at next.
QuickPlace Web caching
Web caching is a new performance-enhancing feature in QuickPlace 3.0. It provides a more efficient way to get information from QuickPlace to Web users. To do this, QuickPlace uses a cache on the server's disk to store pages the user has previously accessed. When the user subsequently reopens the page, the server retrieves the page from the cache rather than re-rendering it from scratch. This can save a considerable amount of time, especially for large and active Places. (Other QuickPlace 3.0 performance enhancements include faster response time for pages in a folder, quicker folder reads, and better memory management.)
Our tests indicated caching significantly improves QuickPlace performance. Many of the improved numbers we derived for QuickPlace 3.0 may be a direct result of this feature. At the same time, we noted some interesting trends behind the numbers. For example, caching appears to work optimally when handling requests from anonymous users. We compared cache utilization with anonymous users versus authenticated users, by looking at the server log entry QuickPlace.Cache.RequestFileCache.HitRate. For anonymous users, this number was over 99, indicating more than 99 percent of the cache was in use—in other words, nearly total utilization. This is because all anonymous users have access to the same information and thus can share an essentially common cache.
For authenticated users, the value of QuickPlace.Cache.RequestFileCache.HitRate was approximately 21, indicating far lower cache utilization. Authenticated users require more unique information than anonymous users, therefore a much smaller portion of the cache is in use at any given time. This may be a point to consider when deciding whether or not to use the Web cache feature, especially if your site has limited disk space on which to place the cache. (If the cache runs out of space frequently, it must constantly remove cached pages to store new ones, which reduces its effectiveness.) But for most sites, Web caching should prove to be an important component of improved QuickPlace performance.
As mentioned earlier, we are in the process of conducting a complete comparison of QuickPlace 3.0 vs 2.0.8, using a simulated population of authenticated users. We'll publish the results when we conclude the study.
For more information on Web caching, see the LDD Today interview,"Going more (Quick)Places." See also "New features in QuickPlace 3.0" and the QuickPlace documentation in the Documentation Library.
And the winner is...
Our study reveals QuickPlace 3.0 provides significantly better performance than 2.0.8 in terms of user response time, number of hits processed per second, and bytes per second throughput. It also indicates that some user actions require more time than others. The single action consuming the most time is user login, which can be further slowed when authenticating users. And the new Web cache feature appears to be an important performance enhancer, especially in Places trafficked by anonymous users. At the same time, you may want to keep an eye on Web cache utilization, especially on servers with limited disk space.
As we noted earlier, no amount of testing can exactly duplicate every possible customer configuration, and we're working to bring you even more information in the future. However, we feel our tests results provide a clear indication that when compared to its predecessor, QuickPlace 3.0 is not only better—it's definitely faster!
ABOUT THE AUTHORS
Jack Williams has been an Advisory Software Engineer with Product Introduction Engineering for approximately three years, working on projects involving QuickPlace testing, IBM hardware testing in the AIX environment, and various other responsibilities. Previously, Jack spent a year and a half with Lotus Consulting on numerous on-site customer engagements. He spent earlier parts of his career developing database applications and designing wide area networks. Jack is an avid runner, having successfully completed his first marathon this past year, and is an emerging triathlete.
Yuriy Veytsman has been a Staff Software Engineer with Product Introduction Engineering for more than four years, working on projects involving iNotes, Discovery Server, QuickPlace, and Sametime testing, and various other responsibilities. Previously Yuriy was employed developing a variety of software and hardware applications for numerous companies throughout Europe. |
 |