|
|

 [back to "Optimizing server performance: Port encryption & Buffer Pool settings"] [back to "Optimizing server performance: Port encryption & Buffer Pool settings"]
Test Case #2 Results (sidebar)
These are the results we found when testing how the NSF_BUFFER_POOL_SIZE setting affected memory utilization at different user loads. For each of these tests, we used the same one-CPU, 128MB configurations from the previous test, and also used a one-CPU, 256MB configuration.
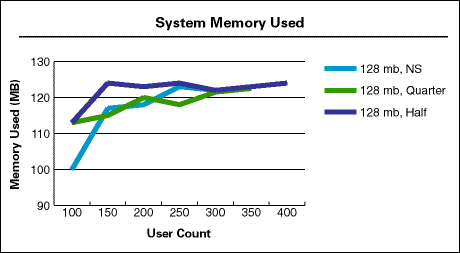
System Memory Used
The Perfmon utility reported the system memory available. The graph below shows the total amount of system memory used to meet the specific workload. We calculated the numbers by subtracting the system memory available from the total amount available, leaving the amount of memory used. Then we divided this number by the number of users. You can use the following graph to plan the amount of memory you need at each user count. You can also figure out, based on how much memory you need, the cost of adding an additional user.
 |
We also used the above graph (System Memory Used) to calculate the rate at which the system allocated memory as the number of users increased. We derived this information from the information reported in the Perfmon Utility. This metric reflects the percentage of increase in the use of memory.
At times there were larger jumps in the memory utilized, leaving less system memory available. This was probably due to cached views in the databases. An example of this happened when we transitioned from 100 to 150 users. The results appear in the following table: |
User Count | No Buffer Pool setting | Buffer Pool set to 1/4 of memory | Buffer Pool set to 1/2 of memory | 1 CPU 256MB |
150 | 71% | 39% | 30% | 46% |
200 | 30% | 55% | 23% | 28% |
250 | 63% | 5% | 43% | 37% |
300 | 10% | 49% | 0 | 27% |
350 | 32% | 25% | 0 | 27% |
400 | 15% | 0 | 0 | 52% |
Overall System Memory Usage Model
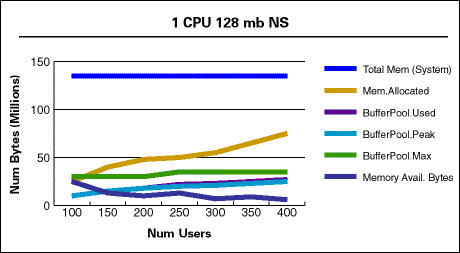
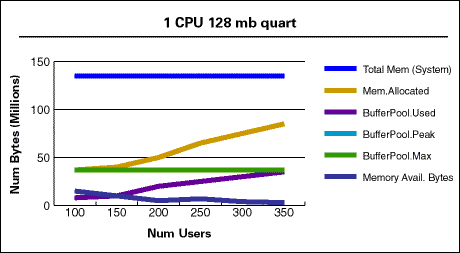
The following graphs illustrate the memory allocation and its relationship to the buffer pool usage for the different NSF_BUFFER_POOL_SIZE specifications; accepting the default, at a quarter of available memory (quart), and at half of available memory (half). |


Buffer Pool Used Usage
The following table illustrates the amount of memory used with each NSF_BUFFER_POOL_SIZE specification, as it related to the user count. We divided the Buffer Pool Used size by the user count to reach this metric. When available memory increases for a given user count, there is an increase in the pool size, up to the maximum amount allowed. The table also shows that the overall average amount of buffer pool memory used was lower when the NSF_BUFFER_POOL_SIZE specification was left at the default specification. At the default specification, the Domino server allocated memory as needed up to approximately a quarter of available memory. This information could help you come up with options to resolve a memory-constrained configuration. |
User Count | No Buffer Pool setting | Buffer Pool set to 1/4 of memory | Buffer Pool set to 1/2 of memory | 1 CPU 256MB |
average | 83K | 105K | 181K | 130K |
maximum | 98K | 114K | 194K | 164K |
In the preceding "Overall System Memory Usage Model" section, you can see how the system used the buffer pool at the various user counts. Looking at the 250-user workload, for example, the maximum amount of the buffer pool used was reached at about 250 users when we didn't specify the NSF_BUFFER_POOL_SIZE setting, and when we specified a quarter of available memory (that is, the maximum that could be allocated was achieved when 250 users were active). After 250 users, the buffer pool can no longer grow and the additional users share the same buffer pool space. In reviewing the usage at half of available memory (a 64MB buffer pool out of a 128MB machine configuration), you can see that the buffer pool did not reach the maximum amount, because the buffer pool used still didn't reach 64MB.
Memory Allocation: Byte Allocation
The values in the following table are the amount of memory allocated by the Domino server, divided by the end user count. The Domino server reported this statistic as part of the Domino statistics. The additional calculation reflects the rate at which the system allocated memory based on the current user count.
The table shows the importance of planning your memory requirements based on the user population. There was a decrease in memory allocation as the user count increased. We included the fixed memory overhead in the metrics, which decreased as the number of users increased. If you have maximized the amount of available memory in your systems, and you cannot currently upgrade them, these benchmarking results can give you some options for dealing with the memory you do have. |
User Count | No Buffer Pool setting | Buffer Pool set to 1/4 of memory | Buffer Pool set to 1/2 of memory | 1 CPU 256MB |
100 | 253K | 291 | 354 | 427 |
150 | 233K | 251 | 355 | 363 |
200 | 237K | 247 | 333 | 330 |
250 | 237K | 260 | 324 | 315 |
300 | 226K | 247 | 0 | 283 |
350 | 215K | 233 | 0 | 261 |
400 | 194K | 00 | 0 | 250 |
|