|
|

 [back to "Optimizing server performance: Port encryption & Buffer Pool settings"] [back to "Optimizing server performance: Port encryption & Buffer Pool settings"]
Test Case #1 Results (sidebar)
These are the results we found when testing how the NSF_BUFFER_POOL_SIZE setting affected performance, versus allowing Domino to allocate the space (which is the default setting). For each of these tests, we used the one-CPU, 128MB configuration.
Processor Utilization
This information comes from the Windows NT Performance Monitor Utility (Perfmon). When we allocated half the available memory in the NSF_BUFFER_POOL_SIZE setting, the CPU utilization was higher. |
User Count | No Buffer Pool setting | Buffer Pool set to 1/4 of memory | Buffer Pool set to 1/2 of memory |
100 | 16% | 13% | 11% |
150 | 17% | 17% | 18% |
200 | 26% | 25% | 29% |
250 | 37% | 26% | 41% |
300 | 32% | 31% | 66% |
350 | 22% | 0 | 0 |
nServer Task Processor Utilization
The following table can help you understand how the Domino nServer task, the main task that starts the server, affects the processor utilization. It does not include response time for other tasks, such as the Indexer or Router tasks. |
User Count | No Buffer Pool setting | Buffer Pool set to 1/4 of memory | Buffer Pool set to 1/2 of memory |
100 | 6% | 6% | 6% |
150 | 9% | 8% | 9% |
200 | 14% | 12% | 15% |
250 | 15% | 7% | 22% |
300 | 10% | 12% | 0 |
350 | 14% | 7% | 00 |
Probe Response Time
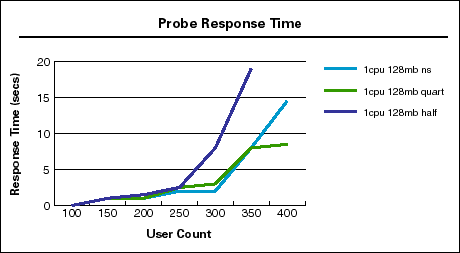
While running the groupware workload on the Domino server, the Server.Planner Probe also executed. This probe simulated an end user connecting to a shared database. For this workload, the probe actually returned a worst-case value, as it tried to attach to a database that the users, simulated through the groupware workload, were also accessing. The following table shows the probe response time in seconds: |
User Count | No Buffer Pool setting | Buffer Pool set to 1/4 of memory | Buffer Pool set to 1/2 of memory |
100 | .04 | .48 | .56 |
150 | .06 | .43 | .88 |
200 | .98 | 2.18 | 2.24 |
250 | 1.01 | 2.93 | 8.32 |
300 | 8.73 | 8.85 | 19.05 |
350 | 14.49 | 8.97 | 0 |
| You can analyze this same information through a graph. Notice how the configuration for one CPU, 128MB, with the NSF_BUFFER_POOL_SIZE set to half the available memory produced the best system response time when compared to the other one-CPU, 128MB configurations. This graph illustrates the system response level and how, after 300 users, specifying the NSF_BUFFER_POOL_SIZE setting at a quarter of the available memory, yielded improved performance results.

|
|